Every teardown in this series has been building towards one comparison. On the left, the money a homeowner commits. On the right, the money that stops leaving the household every month. The final slide of the deck puts the two side by side, and the result is the clearest single answer the model produces.
The investment column reads roughly $11,290 of net capital cost, plus the predictable seasonal maintenance routines that keep the asset on its engineered baseline. The return column reads an average monthly power bill reduction of $196, which the deck translates into roughly $14 per panel in monthly savings. That second number is the one worth carrying around.
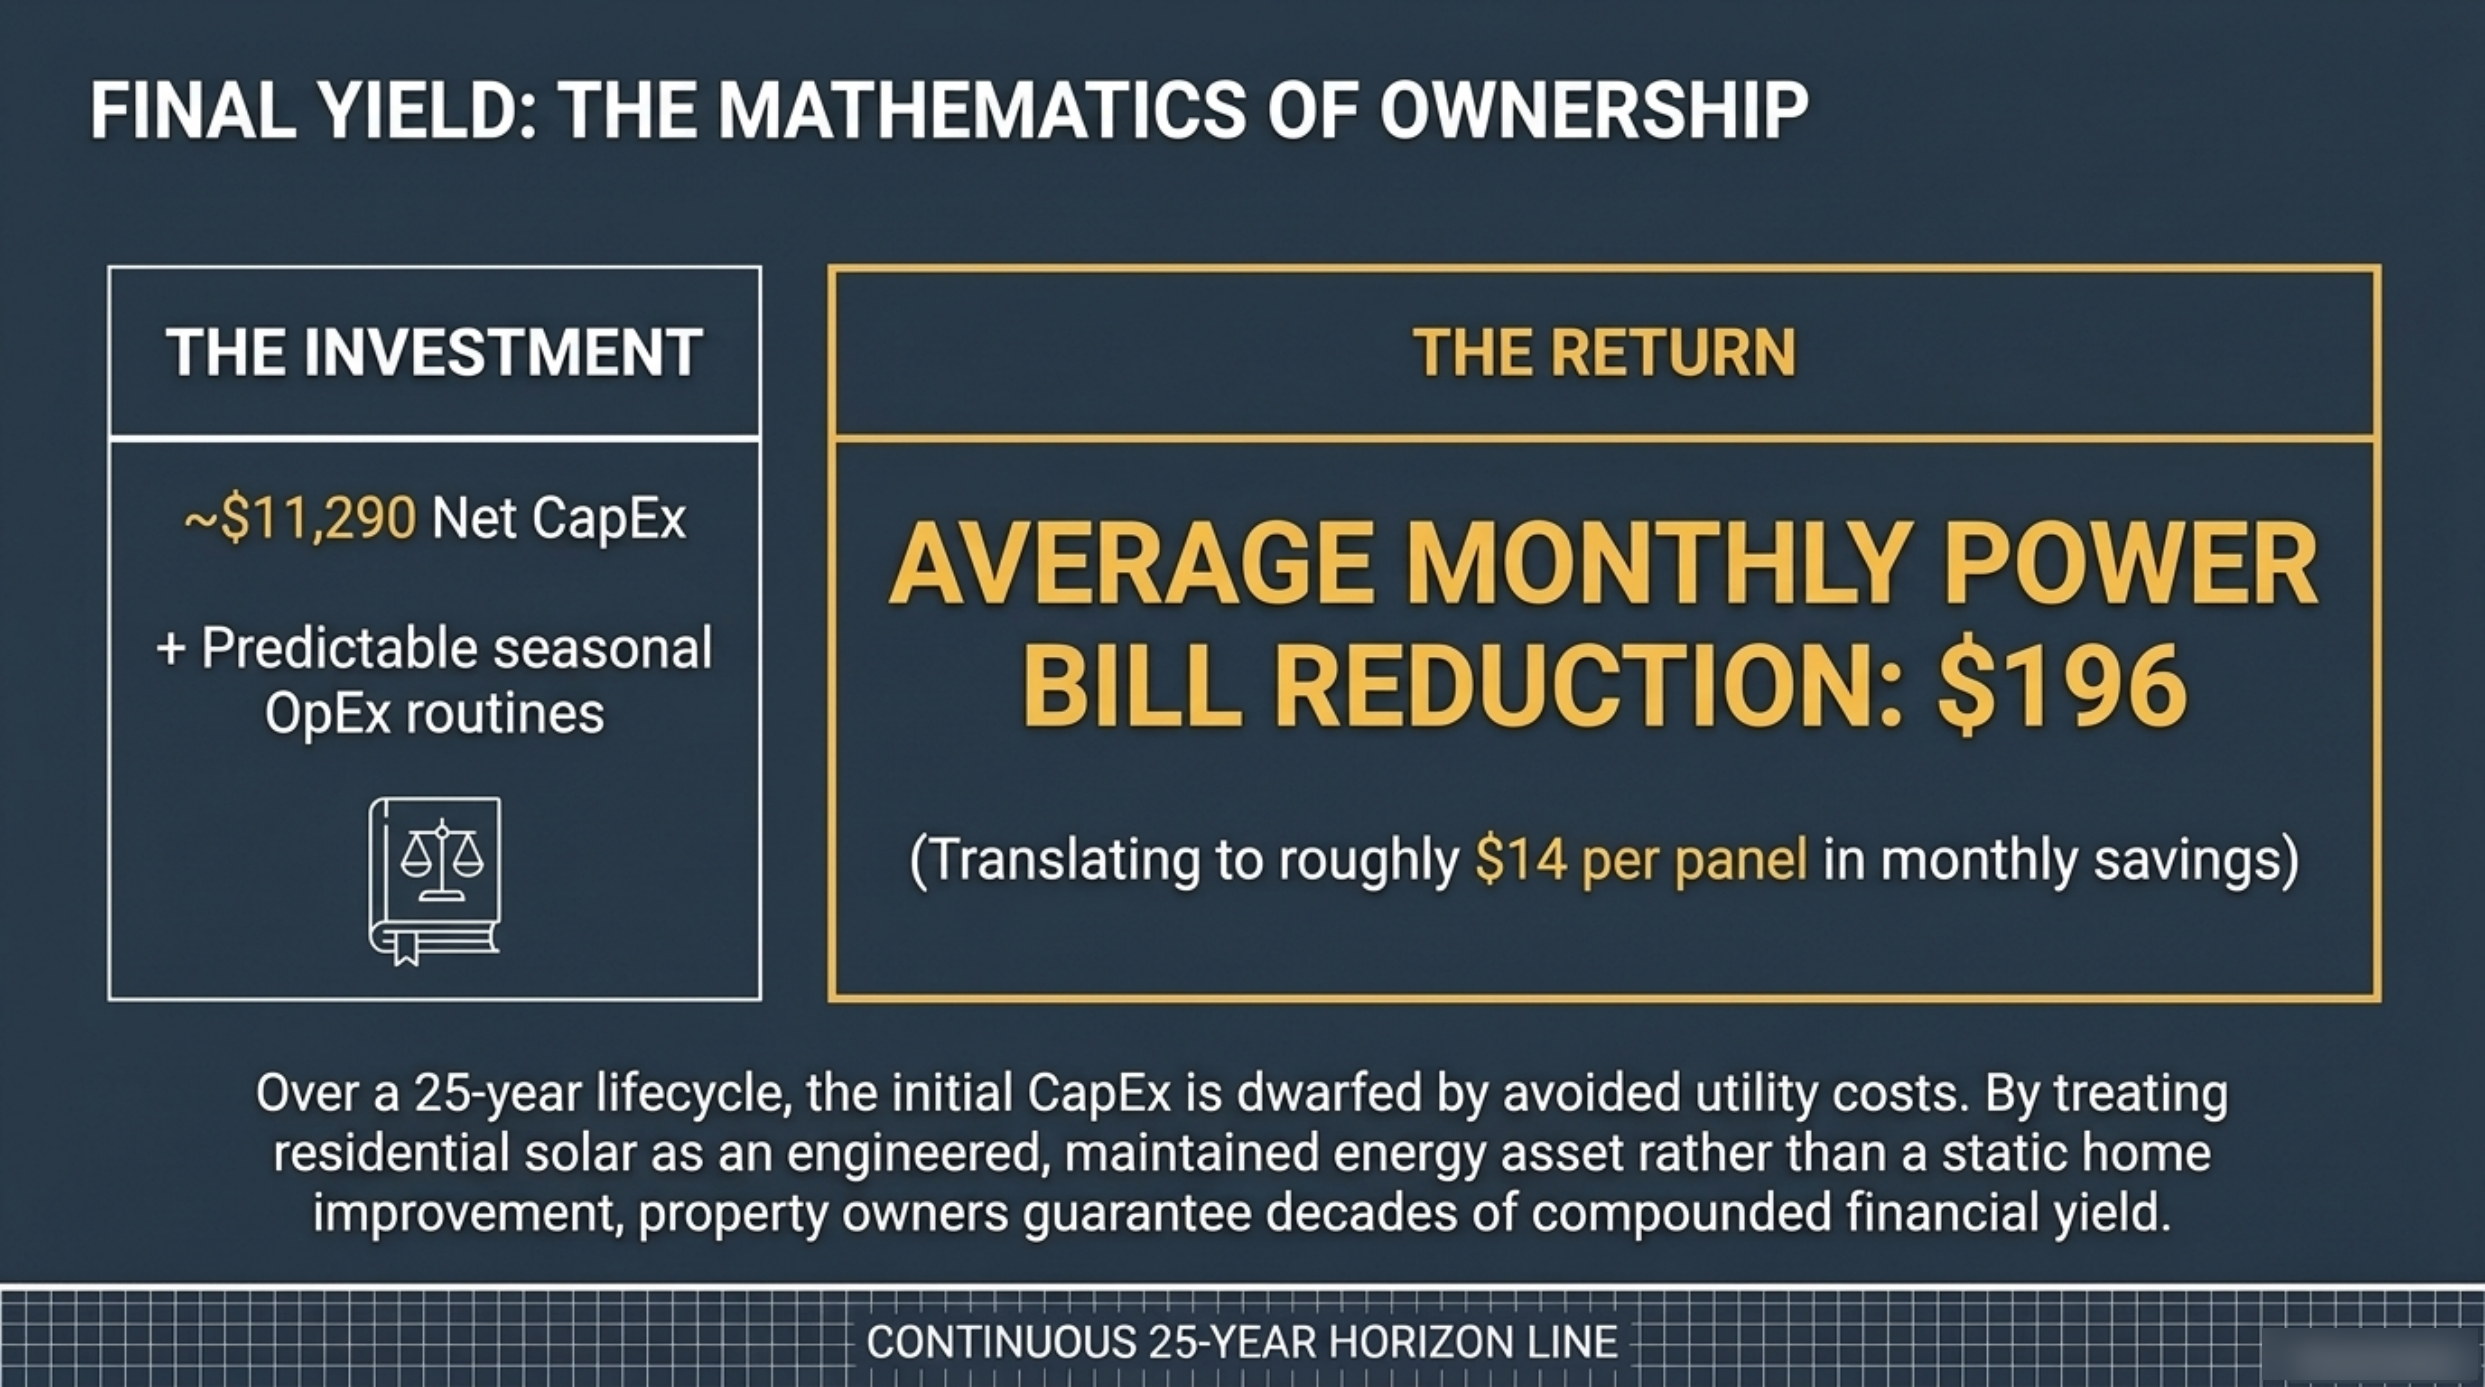
The investment column: $11,290 net
The capital figure is the net one. Gross cost on the deck's baseline is $16,129, and the 30% federal Clean Energy Tax Credit removes about $4,839 of that, leaving $11,290 as the true starting point for the return calculation. Below it sits a much smaller line: the seasonal cleaning, inspection and winter routines that keep the array producing what it was engineered to produce.
That pairing is what makes the asset framing useful. Solar is not a home improvement that ends at installation and is then forgotten. It is an engineered system with capital, operating cost and yield, and the maintenance routines are what preserve the yield the investment was underwritten against. Our year-round maintenance schedule covers what those routines actually involve in Flagstaff.
The return column: $196 a month
The return side is expressed as avoided cost, which is the correct way to measure it. A grid-connected array does not send the homeowner a cheque; it reduces the electricity the household has to buy from the utility each month, and the amount it reduces is the return. The deck's average figure is $196 per month.
| Side of the ledger | Composition | Figure |
|---|---|---|
| Investment | Net CapEx after the 30% federal credit | ~$11,290 |
| Investment | Predictable seasonal OpEx routines | Recurring |
| Return | Average monthly power bill reduction | $196 |
| Return | Savings per panel, per month | ~$14 |
| Return | Annualised bill reduction | ~$2,352 |
Averages do the heavy lifting in that table, and they should be read as such. The $196 is an average across the year, which means the winter months and the summer months will not match it. Flagstaff's seasonal profile moves consumption seasonally as well as generation, so the annual figure is the stable number: around $2,352 of avoided electricity cost in a typical year, against a capital commitment that was made once.
$14 a panel is the number that makes it legible
Dividing $196 by the baseline array's fourteen panels gives $14. The deck presents it as roughly $14 per panel in monthly savings, and it earns its place because it rescales an abstract five-figure investment into something a homeowner can hold. Fourteen dollars a month is a subscription. Fourteen dollars a month, fourteen times over, is $196.
| Metric | Value | How it is derived |
|---|---|---|
| Panels in the baseline array | ~14 | Deck baseline for an average residential setup |
| Monthly bill reduction | $196 | Deck average across the year |
| Savings per panel, per month | ~$14 | $196 ÷ 14 panels |
| Panel-level saving over a year | ~$168 | $14 × 12 months |
| Array-level saving over a year | ~$2,352 | $196 × 12 months |
The per-panel view is also a useful sanity check on sizing. If your own array is modelled with sixteen panels rather than fourteen, the expected monthly reduction should scale in the same proportion — roughly $224 rather than $196, all else equal. A proposal that promises panel-count savings far above that ratio is worth interrogating on its assumptions, because the deck's per-panel figure is the anchor.
Four point eight years to recover the capital
Put the two columns together and the payback arithmetic is simple. At $2,352 of avoided cost a year against $11,290 of net capital, the capital is recovered in roughly 4.8 years. Everything after that point is a system that has been paid for and is still producing, which is the entire reason the twenty-five-year framing exists.
Across a full twenty-five-year lifecycle at the same average rate, the avoided cost totals around $58,800 — roughly five times the net capital commitment. That is the comparison the deck's closing paragraph is making when it says the initial CapEx is dwarfed by avoided utility costs. The figure assumes steady output, which is why retention matters: an array holding 93.0% of capacity at year twenty-five keeps producing near its modelled rate far longer than one holding 84.8%, and we work through that gap in the 25-year divergence curve.
One local caveat belongs here. Because Flagstaff households are billed by APS, the value of each avoided kilowatt-hour depends on the utility's own import rates and on how exported energy is credited, and both are set outside the homeowner's control. The deck's $196 average is the modelled outcome, not a guarantee — and it is the reason the maintenance routines in the investment column matter, since a system that drifts below its engineered baseline earns less than the model projected.
Why the asset framing changes the decision
The closing sentence of the deck is the thesis stated plainly: over a twenty-five-year lifecycle, treating residential solar as an engineered, maintained energy asset rather than a static home improvement is what produces decades of compounded financial yield. That distinction is worth holding on to when a quote lands. A home improvement is judged on how it looks and what it cost. An asset is judged on what it returns and how long it keeps returning it.
Judged as an asset, the numbers on this slide read as a coherent whole: $11,290 in, $196 a month out, $14 per panel as the unit economics, and roughly five years to recover the capital with two decades of production behind it. For the wider question of whether the return justifies the investment in this market, Is Solar Worth It in Flagstaff? takes that view directly.
Call (928) 698-6192 for free, no-obligation quotes from pre-vetted Flagstaff solar professionals.
Frequently asked questions
Where does the $14 per panel figure come from?
It is the deck's $196 average monthly bill reduction divided by the fourteen panels in the baseline array. It is a unit-economics figure rather than a quote, and it scales with panel count: a sixteen-panel array modelled on the same assumptions would imply roughly $224 a month.
How long does it take for the savings to cover the net capital cost?
At $196 a month, the annual avoided cost is about $2,352. Against $11,290 of net capital after the 30% federal credit, that recovers the investment in roughly 4.8 years, after which the array continues producing without capital servicing costs.
Does the $196 monthly figure apply to every month?
It is an average across the year. Consumption and generation both move seasonally in Flagstaff, so individual months will sit above or below it. The annual figure — around $2,352 of avoided electricity cost — is the stable number to plan against, and the value of each avoided kilowatt-hour depends on APS import rates and export credits.