Sizing a solar array is not a matter of picking the biggest number you can afford. It is a matter of matching nameplate capacity to annual consumption, and then checking whether the resulting bill reduction justifies the cash you put in. Get that wrong in one direction and you spend years paying for kilowatt-hours you never use. Get it wrong in the other and you keep buying power from the utility at $0.16 per kilowatt-hour while your roof sits underused.
This comparison runs the workbook's dynamic sizing model across five residential capacities: 5 kW, 6 kW, 7 kW, 8 kW and 10 kW. Every size is priced at the same $2.56 per watt gross, and every size receives the same 30% federal Investment Tax Credit. Because the per-watt price and the credit rate are constant, the differences between the rows are pure scale — which is what makes the table useful for choosing rather than just comparing.
Every size, priced and modelled

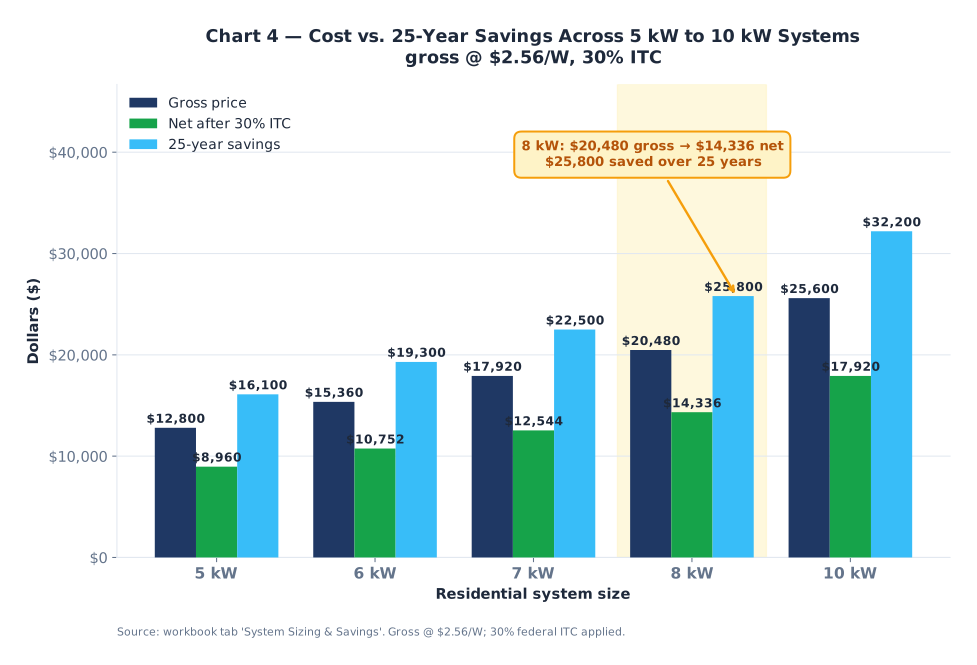
The first table is the decision table. Gross price scales at exactly $2.56 per watt, the tax credit at exactly 30%, and the 25-year savings figure at roughly $3,220 per kilowatt. Nothing in this model has a sweet spot or a penalty zone — you are choosing how much capacity to buy, not which size is most efficient to buy.
| System size | Gross price | 30% ITC | Net after ITC | 25-year savings | Return on net cost |
|---|---|---|---|---|---|
| 5 kW | $12,800 | $3,840 | $8,960 | $16,100 | 1.80× |
| 6 kW | $15,360 | $4,608 | $10,752 | $19,300 | 1.79× |
| 7 kW | $17,920 | $5,376 | $12,544 | $22,500 | 1.79× |
| 8 kW | $20,480 | $6,144 | $14,336 | $25,800 | 1.80× |
| 10 kW | $25,600 | $7,680 | $17,920 | $32,200 | 1.80× |
That constant 1.8× return multiple is the single most useful fact in the table. It means the sizing question is not "which size gives the best return", because they all give the same one. The question is "how much of my bill do I want to replace", because each additional kilowatt costs $2,560 gross and $1,792 net, and returns about $3,220 over 25 years regardless of where you stop.
How much of the bill each size actually offsets
Cost per watt is constant, but offset is not. The workbook's energy profile assumes a $180 monthly electric bill at $0.16 per kilowatt-hour, which implies 1,125 kWh per month, or 13,500 kWh per year. On the production side, the model uses 5.2 peak sun hours per day for Flagstaff and an 82% de-rate factor covering inverter losses, wiring, climate and tilt. Annual production for any capacity is therefore kilowatts multiplied by 5.2, by 365 days, by 0.82.
| System size | Implied annual production | Share of 13,500 kWh | Net cost per watt | Savings per kW |
|---|---|---|---|---|
| 5 kW | 7,782 kWh | 57.6% | $1.79/W | $3,220 |
| 6 kW | 9,338 kWh | 69.2% | $1.79/W | $3,217 |
| 7 kW | 10,895 kWh | 80.7% | $1.79/W | $3,214 |
| 8 kW | 12,451 kWh | 92.2% | $1.79/W | $3,225 |
| 10 kW | 15,564 kWh | 115.3% | $1.79/W | $3,220 |
Production figures in Table 2 are computed from the workbook's own 5.2 peak sun hours and 82% de-rate assumptions. Read the middle column carefully, because it is where sizing decisions are actually made. A 5 kW array covers 57.6% of an average Flagstaff household's consumption. A 7 kW array covers 80.7%. An 8 kW array covers 92.2%, which is the closest any size in the model comes to a full offset without overshooting. A 10 kW array produces 115.3% of annual consumption, meaning roughly 2,064 kWh per year of surplus.
Surplus production is not wasted, but it is worth less than self-consumed production. Whether the excess is credited at a favourable export rate or at a reduced one is a utility tariff question rather than a technical one, and it is the reason an oversized array can carry the same 1.8× workbook return while delivering a worse real-world result than the model implies.
Physical footprint and panel count
The workbook specifies 400-watt modules as the standard 2026 TOPCon panel, which converts each capacity into a countable number. Roof area, not physics, usually decides how far up this table a Flagstaff home can go.
| System size | 400 W modules | Net cost | Best suited to |
|---|---|---|---|
| 5 kW | 13 panels (12.5 exactly) | $8,960 | Small roofs, low consumption, first-time buyers testing solar |
| 6 kW | 15 panels | $10,752 | Households with modest air-conditioning load or heavy shading |
| 7 kW | 18 panels (17.5 exactly) | $12,544 | The 80% offset target without a battery |
| 8 kW | 20 panels | $14,336 | Near-total offset on a $180/month bill, with room for future load |
| 10 kW | 25 panels | $17,920 | Electric heat, EV charging or a future heat-pump conversion |
Panel counts are derived by dividing nameplate capacity by 400 watts; the fractional values for 5 kW and 7 kW are shown because they explain why those two capacities quote awkwardly — 12.5 and 17.5 panels cannot be ordered, so either the panel count is rounded up or a slightly different module is substituted. That rounding is one of the few places where a system's actual capacity will drift from its nominal label.
Anchoring the decision at 8 kW
The 8 kW column is highlighted in Chart 4 because it is the configuration that lines up with the rest of this model. It reaches break-even in year 7 on a cash purchase, carries a net cost of $14,336 after the 30% tax credit, and returns $25,800 over 25 years. It offsets 92.2% of an average household's consumption without generating a meaningful surplus, and it lands at 20 modules, which fits comfortably on most Flagstaff roofs.
Sizing below 8 kW is a rational choice when roof area is limited or consumption is genuinely lower than the workbook's baseline. Sizing above it only makes sense if there is a known future load — an EV, a heat pump, a home addition — because the model's returns are flat across sizes but the value of surplus generation is not. The 10 kW system's extra 2 kW costs $3,584 net and adds $6,400 of 25-year savings, exactly in line with the constant 1.8× multiple, but only if the kilowatt-hours get used or credited fairly.
Call (928) 698-6192 for free, no-obligation quotes from pre-vetted Flagstaff solar professionals.
Frequently asked questions
- Is 5 kW or 10 kW better value?
- Both return about 1.8× their net cost over 25 years — 5 kW returns $16,100 on $8,960 and 10 kW returns $32,200 on $17,920. Value per dollar is constant; the difference is how much bill you replace and how much roof you use.
- What size solar system do I need for a $180 monthly bill?
- An 8 kW system produces an estimated 12,451 kWh per year against 13,500 kWh of consumption — a 92.2% offset — at a net cost of $14,336 after the 30% ITC.
- How many panels is that?
- At the workbook's 400 W standard module, an 8 kW system is 20 panels. The 5 kW and 7 kW systems land on 12.5 and 17.5 panels, which is why those capacities often get rounded or re-specified.
- Does an oversized system still pay?
- The workbook model is linear, so 10 kW returns 1.8× just like every other size. But it produces 115.3% of the household's consumption, so the return depends on how your utility credits exported kilowatt-hours.