Every solar quote arrives with a datasheet, and almost nobody reads it properly. That is a problem, because the difference between a mid-tier module and a premium one is not visible on the roof and not visible on the invoice — it is visible in a table of five columns, two of which actually decide what the system delivers in year twenty-five.
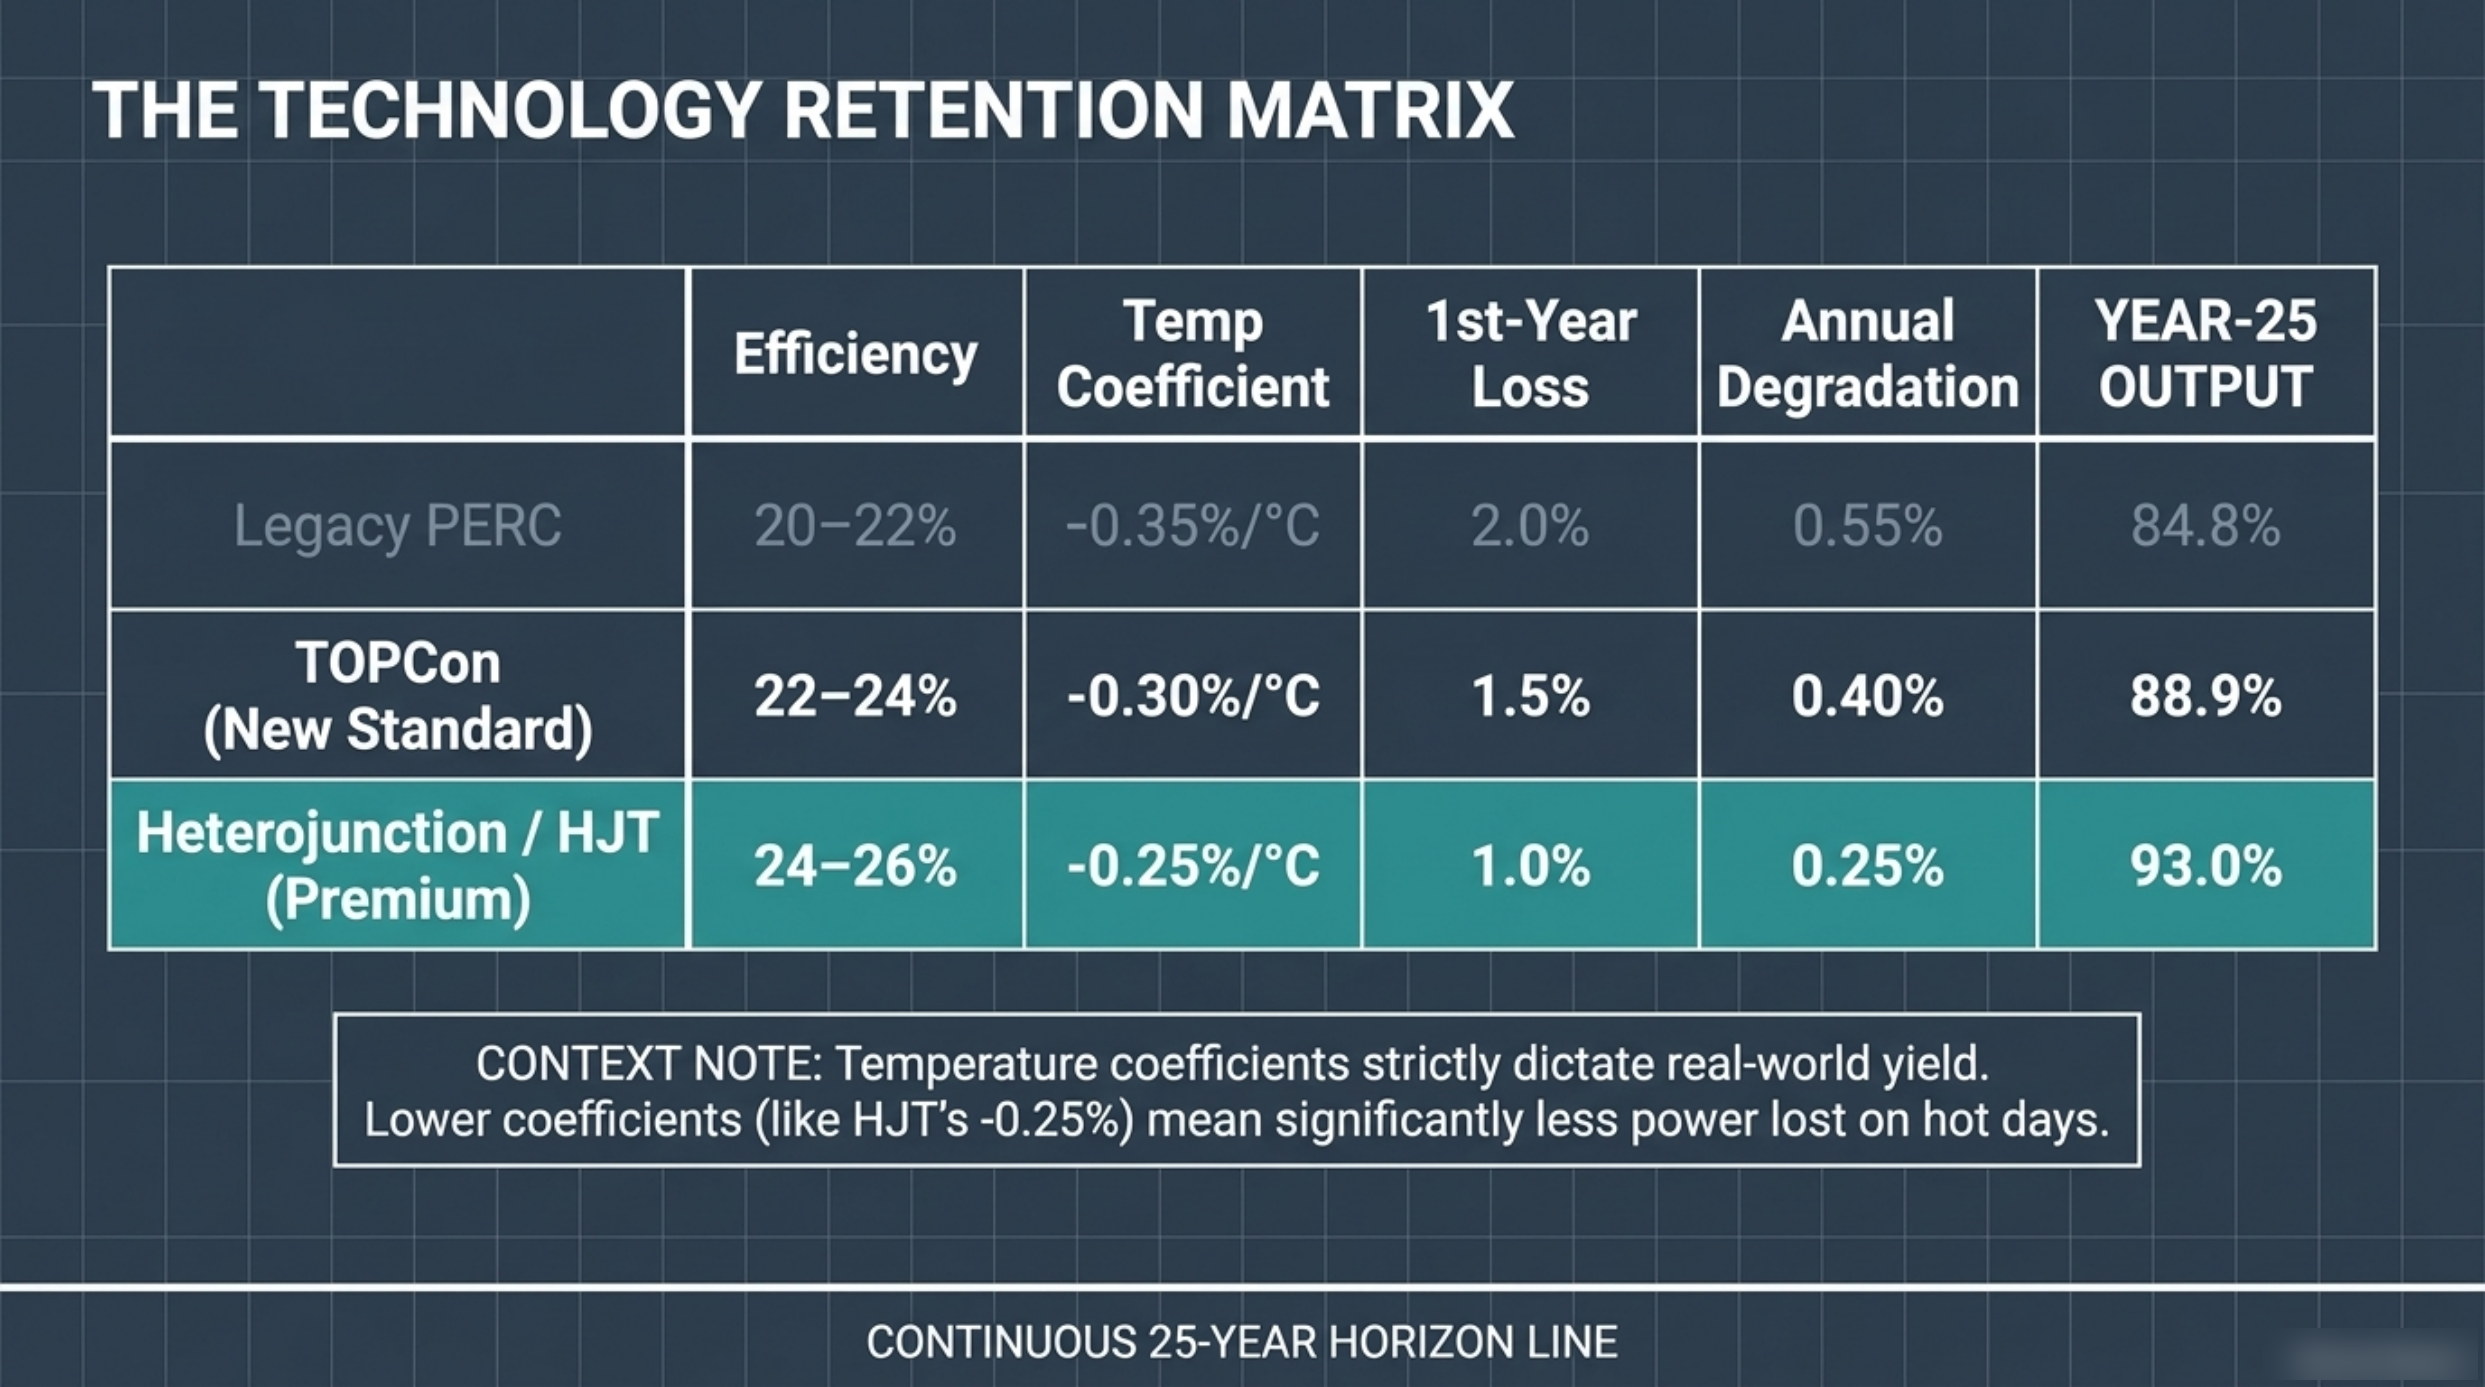
The deck's technology retention matrix lays three commercial cell architectures side by side: legacy PERC, TOPCon and heterojunction. Each row carries an efficiency band, a temperature coefficient, a first-year loss, an annual degradation rate and a year-25 output figure. Read as a whole, the table is not a ranking. It is a decoding tool, and this is how to use it.
The table has five columns and two of them decide the outcome
Efficiency, first-year loss and year-25 output are the columns buyers look at. Temperature coefficient and annual degradation are the columns that get skipped, and they are the two that generate the others. A coefficient determines how much output is lost on a hot day; an annual degradation rate determines how much is lost over a lifetime. Everything else in the row is downstream.
| Architecture | Efficiency | Temp coefficient | 1st-year loss | Annual degradation | Year-25 output |
|---|---|---|---|---|---|
| Legacy PERC | 20–22% | −0.35%/°C | 2.0% | 0.55% | 84.8% |
| TOPCon (new standard) | 22–24% | −0.30%/°C | 1.5% | 0.40% | 88.9% |
| Heterojunction (HJT, premium) | 24–26% | −0.25%/°C | 1.0% | 0.25% | 93.0% |
Efficiency band: what the array captures on day one
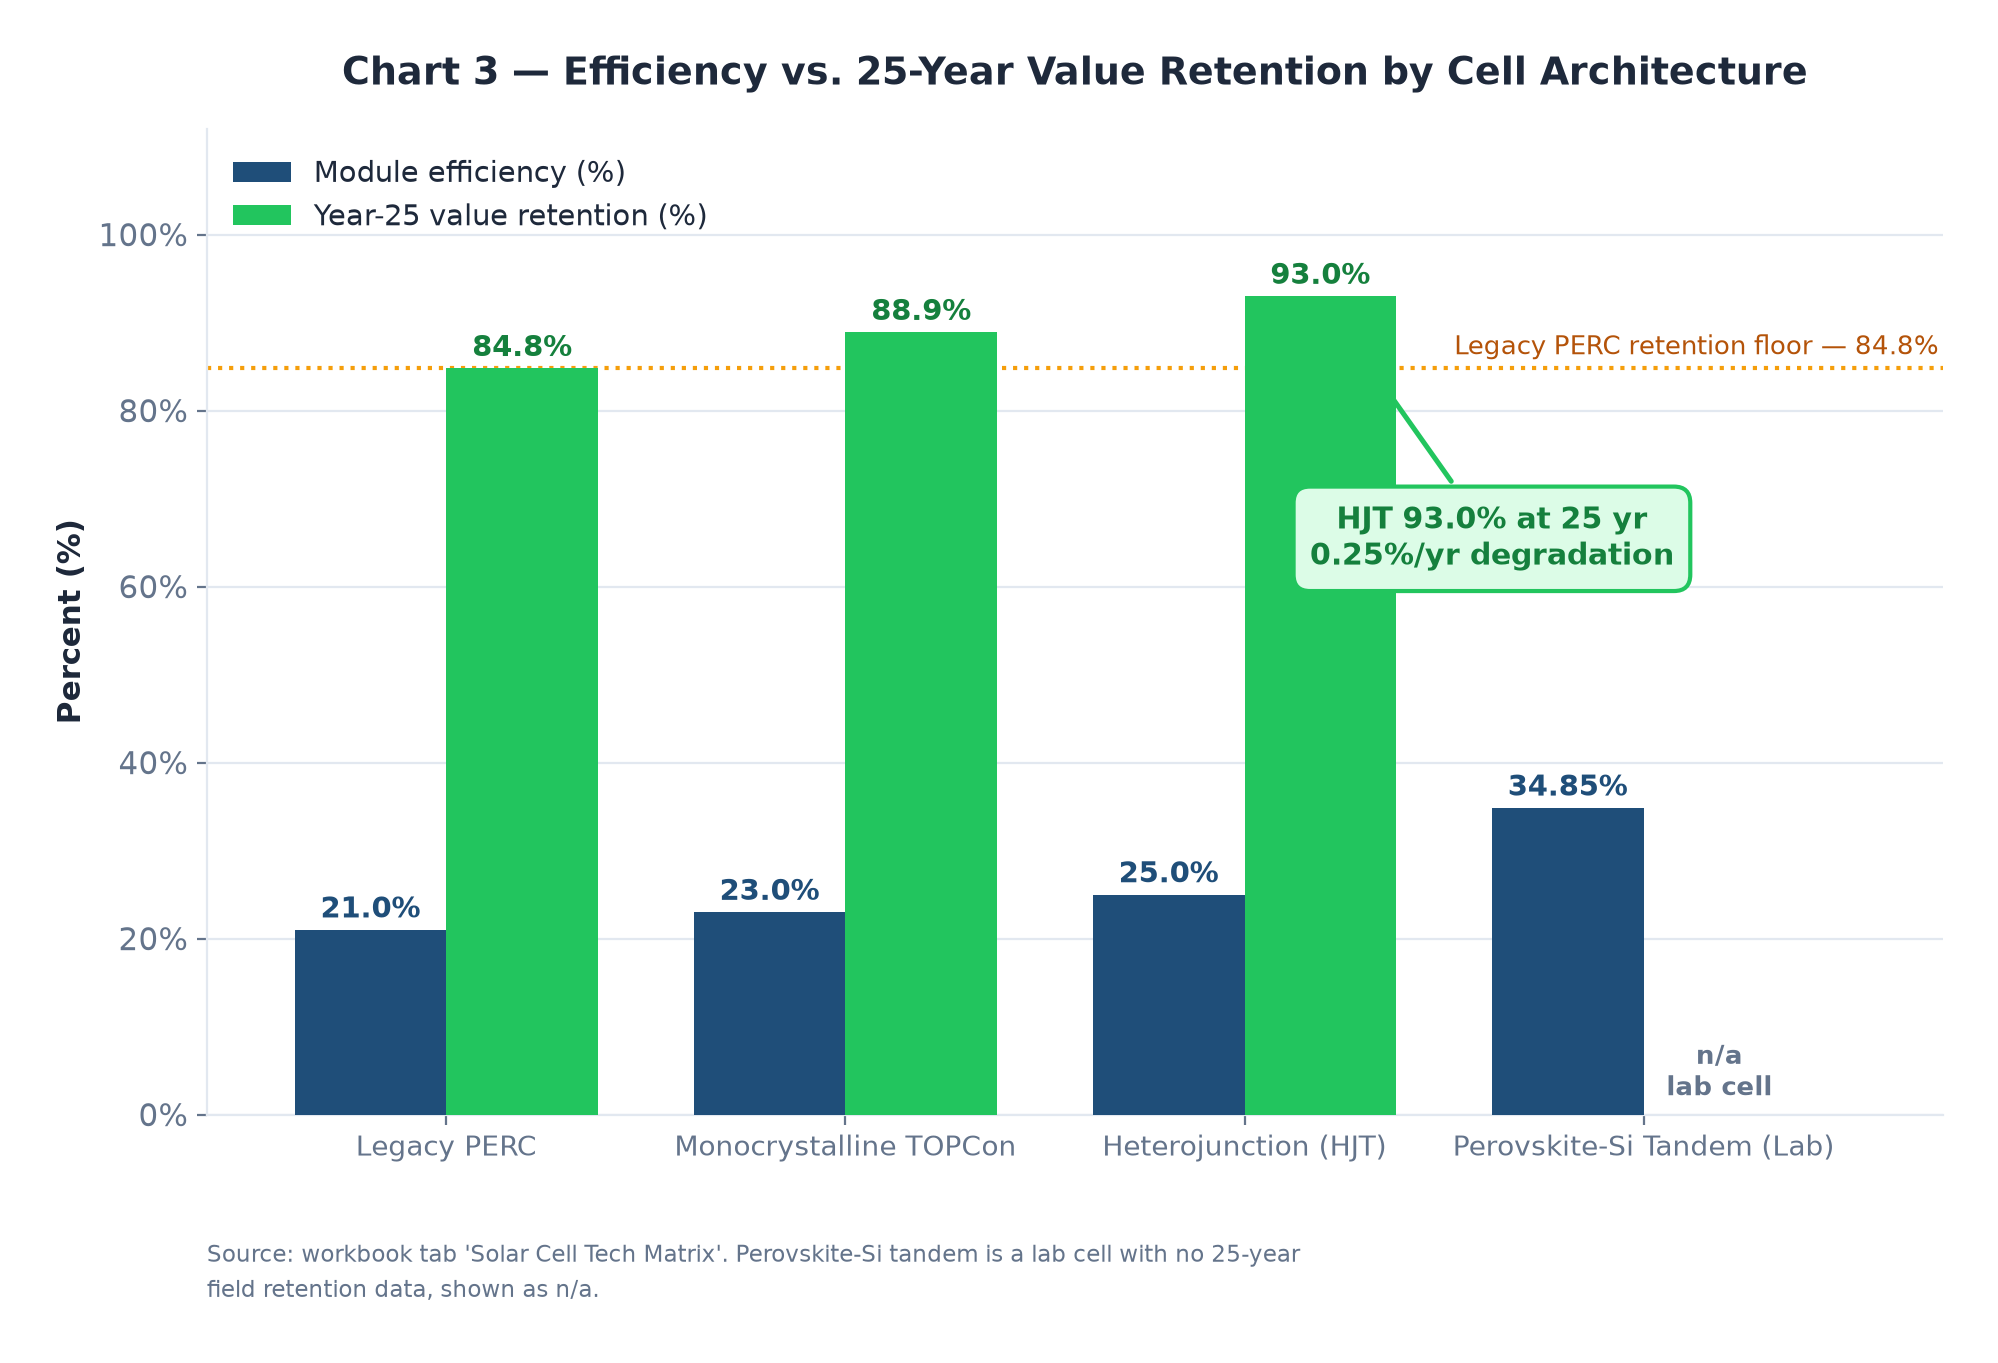
The efficiency column is the most quoted and the least decisive. PERC sits at 20–22%, TOPCon at 22–24% and heterojunction at 24–26%. That spread does two things. It reduces the number of panels needed for a given capacity, which matters on a constrained Flagstaff roof, and it lifts day-one output for the same installed wattage, which matters on every day thereafter.
What it does not do is decide the twenty-five-year outcome, because efficiency is a starting condition rather than a trajectory. A 26% module and a 21% module both begin losing output the day they are energised, and the rates at which they lose it diverge far more than their starting points ever did.
Temperature coefficient: the column built for hot days
The temperature coefficient describes how much output a module loses for every degree its cells sit above the standard test condition reference of 25°C. PERC loses 0.35% per degree, TOPCon 0.30%, heterojunction 0.25%. On a bright Flagstaff roof in summer the cell temperature routinely sits far above that reference, which means the coefficient is not a laboratory footnote — it is the rule that governs most of the array's productive hours.
The deck's context note puts it plainly: temperature coefficients dictate real-world yield, and lower coefficients mean significantly less power lost on hot days. The arithmetic is direct. A cell sitting 25°C above the reference loses 8.75% of its output on PERC, 7.5% on TOPCon and 6.25% on heterojunction. Against a 6,300 watt baseline that is roughly 551 watts of hot-day loss on PERC versus 394 on HJT — a difference of more than 150 watts arising from one coefficient.
From 2.0% and 0.55% to 84.8%: how degradation compounds
The last two columns are where the row becomes a projection. First-year loss captures the initial settling that modules experience, and it differs materially between architectures: 2.0% on PERC, 1.5% on TOPCon, 1.0% on heterojunction. Annual degradation then applies to whatever is left, year after year.
That sequence is why small rate differences produce large endpoint differences. Compounding is unforgiving in both directions. A 0.55% annual rate against a 0.25% rate looks like a rounding error on a datasheet; applied across two decades of generation it separates two modules that were specified in the same week and installed on the same roof. We cover the same three architectures from the value-retention angle in TOPCon vs. HJT vs. PERC, and the shape of that divergence in our article on the 25-year divergence curve.
Year-25 output: the only column that matters at the end
The final column is the summary of the other four. Legacy PERC holds 84.8% of output at year twenty-five. TOPCon holds 88.9%. Heterojunction holds 93.0%. Nothing in the row is more important than that number, because it is the multiplier that converts a system's nameplate capacity into the electricity it will actually sell or offset in the final years of its warranty.
The practical use of this table is comparative shopping. When two quotes differ by a few hundred dollars on hardware and by several points of year-25 retention, the cheaper quote is not automatically the cheaper system. Reading the row before comparing the price is the whole exercise — and if you want to see how the day-one efficiency and the long-term retention combine on a real baseline array, the total cost of ownership teardown runs both through the same model.
Call (928) 698-6192 for free, no-obligation quotes from pre-vetted Flagstaff solar professionals.
Frequently asked questions
Which column of the matrix matters most?
Year-25 output, because it is the one that converts nameplate capacity into long-term value. But it is generated by the two columns most often skipped: the temperature coefficient and the annual degradation rate. Read those two first and the final column becomes predictable rather than surprising.
Why is the temperature coefficient important in Flagstaff?
Because a solar cell's output falls as its temperature rises above the 25°C test reference, and cells on a sunlit roof run well above it. The coefficient states how much output is lost per degree, so a lower figure means less power shed during the sunniest hours of the year.
Is higher efficiency worth paying for?
It depends on your roof. Efficiency in the 24–26% band reduces the panel count needed for a given capacity, which helps on a constrained roof, and it lifts day-one output. What it does not do is change the degradation trajectory, so a high-efficiency module with a poor annual degradation rate can still lose the 25-year comparison.