The Global Shift to Solar + Storage - and What It Means for Flagstaff
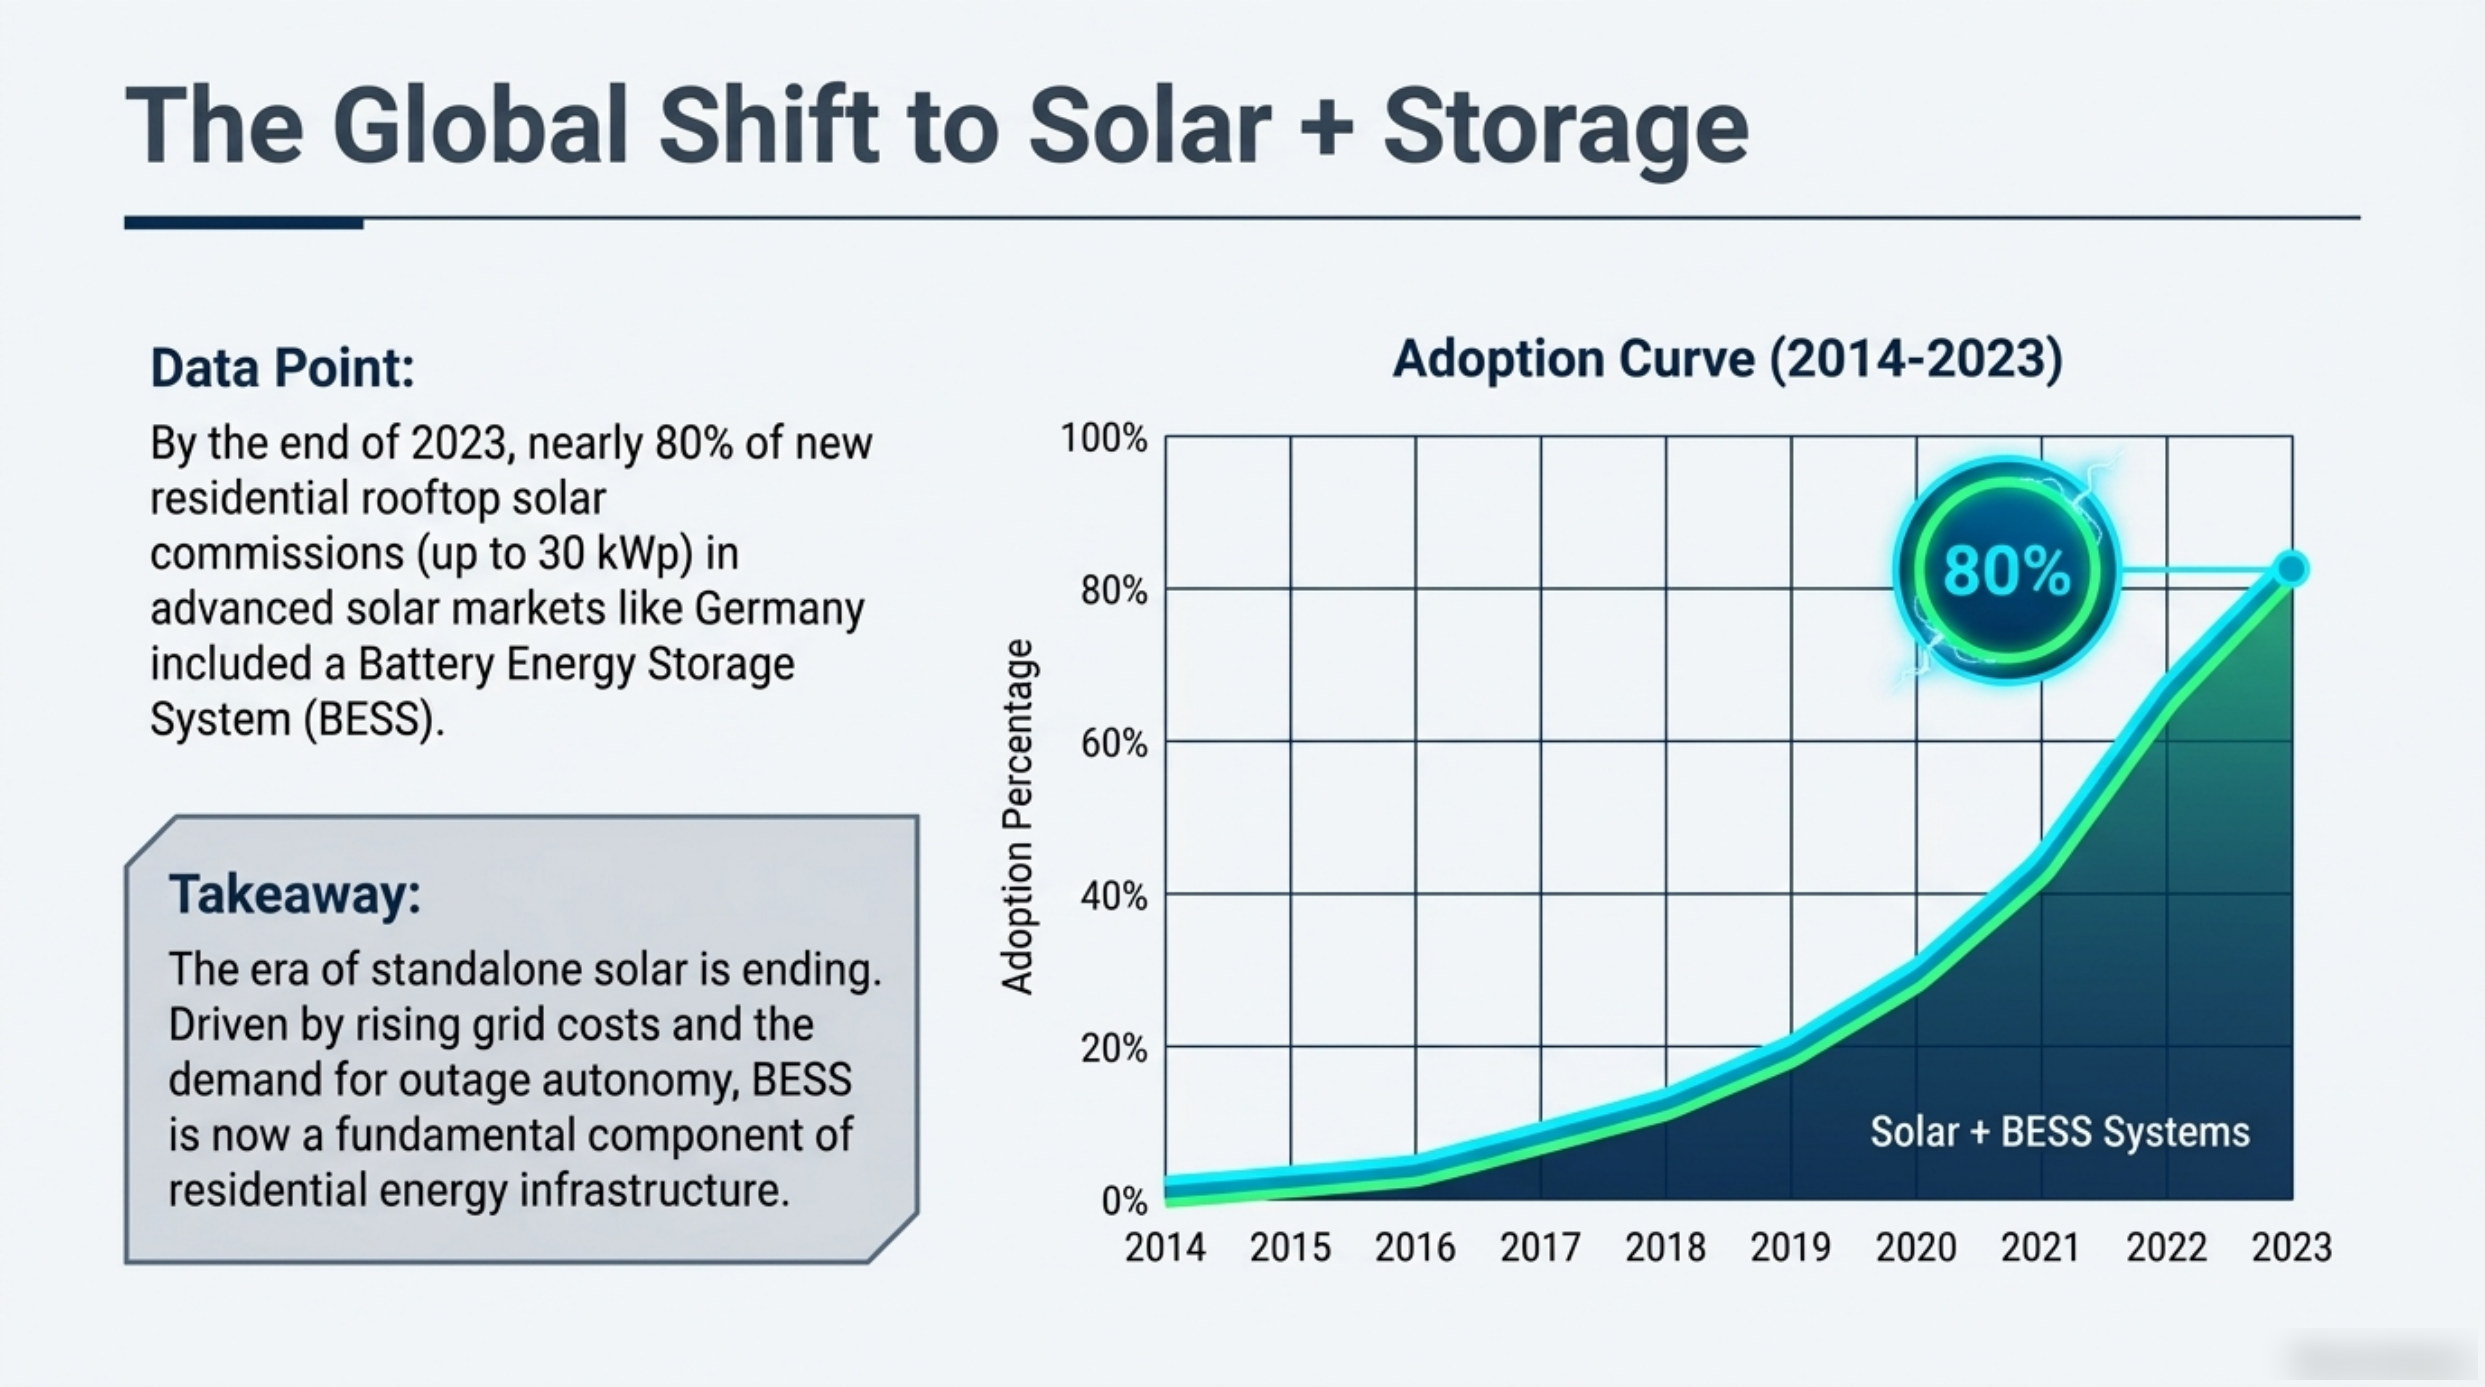
Solar installers used to describe batteries as an optional extra — something a homeowner could add if outage protection mattered more to them than payback. The deck this article comes from charts the moment that framing stopped being true. Its adoption curve runs from 2014 to 2023 and plots a single, tightly defined quantity: the share of new residential rooftop solar commissions that included a battery energy storage system as part of the same project.
The shape of that curve matters more than any single point on it, because what it describes is a change in default behaviour rather than a change in technology. Panels did not suddenly become better at making electricity between 2014 and 2023. What changed is that a homeowner specifying a new system stopped treating storage as a separate decision.
The short version
- By the end of 2023, nearly 80% of new residential rooftop solar commissions up to 30 kWp in advanced solar markets included a battery energy storage system.
- The 2014-2023 curve plotted in the deck measures that share of new commissions, not total installed capacity.
- Two forces drive it: rising grid costs and homeowner demand for outage autonomy.
- The deck's takeaway is blunt: the era of standalone solar is ending, and storage is now a standard component of residential energy infrastructure.
What the curve actually measures
Adoption curves are easy to misread, so it is worth being precise about this one. The vertical axis is a percentage of new commissions, not a percentage of homes, and not a count of batteries in service. The horizontal axis is time. In other words, the curve answers one question: of all the residential rooftop systems being ordered in a given year, how many were ordered with storage attached?
There is also a size boundary built into the measurement. The figure the deck cites is drawn from residential rooftop commissions up to 30 kWp, which is the scale of system that looks like a house rather than a small commercial building. That boundary keeps the curve honest about what it is describing: normal roofs, normal households, normal electrical panels.
The end-of-2023 marker: nearly 80%
The headline fact from the slide is that by the end of 2023, nearly 80% of those new residential rooftop commissions in advanced solar markets included a battery energy storage system. Read against the 2014 start of the curve, that is not a gradual trend line. It is a category inverting itself, from add-on to default, inside a decade.
| Marker on the curve | Value |
|---|---|
| Period measured | 2014 to 2023 |
| What is being counted | New residential rooftop solar commissions that included a BESS |
| System size band | Up to 30 kWp |
| End-of-2023 share | Nearly 80% |
| Where it applies | Advanced solar markets — those with the longest history of residential adoption |
| Deck takeaway | The era of standalone solar is ending |
The comparison worth holding onto is between the nearly 80% figure and everything that came before it on the same axis. A market where four out of five new residential systems are ordered with storage is no longer a market where storage is an upgrade. It is a market where storage is part of the specification.
Two forces behind the curve
The deck attributes the shift to two pressures rather than one, and they are worth separating because they appeal to different homeowners. The first is rising grid costs. As the price of imported electricity climbs, the value of using your own generation on site climbs with it, and a battery is the only way to hold daytime generation over into the expensive hours. The second is demand for outage autonomy. A grid-tied array shuts down in an outage by design, so a homeowner who wants power during an outage is not buying more panels — they are buying storage.
Those two forces produce the same purchase decision from opposite directions. One is a running-cost argument, the other is a resilience argument, and between them they account for why the curve bends the way it does. A homeowner who finds either argument persuasive ends up at the same line item on the quote.
What it means for a Flagstaff roof in APS territory
The curve is drawn from advanced solar markets, and Flagstaff is not one — this is a smaller, younger market with a shorter history of residential adoption. That is precisely what makes the chart useful here. It is a preview of where a market moves once homeowners start pricing the evening differently from the afternoon, and the mechanism that drives the move is already present in APS territory: daytime export compensation is modest, and evening import prices are not.
The practical reading for a Flagstaff homeowner is not that storage is mandatory. It is that the decision has changed shape. Five years ago the question was whether to add storage to a solar system. The question now, in markets a step or two ahead of ours, is why anyone would specify a system incapable of accepting it — a design decision that costs very little upfront and a great deal to undo later.
How to use an adoption curve honestly
A curve like this one is a description of decisions other people have already made, not a prediction about your roof. It cannot tell you whether your particular consumption profile, roof orientation and electrical situation make storage sensible today. What it can tell you is that the burden of proof has moved: in a mature market, solar without storage is now the configuration that has to be justified, not the other way around.
For the hardware picture, see our solar battery guide. For what the competing storage technologies cost and promise, the 2026 storage showdown compares the main candidates directly. The site's free calculators hub covers storage sizing and outage autonomy if you want to model it yourself. And if you want the storage decision priced against an actual Flagstaff roof, call (928) 698-6192 or request free quotes through the form on this page — no obligation.
Frequently Asked Questions
Does the nearly 80% figure mean most homes now have batteries?
No. It describes the share of new residential rooftop commissions in advanced solar markets at that point in time. The number of homes with a battery installed across the whole housing stock is much lower, because it reflects a decade of new installations rather than the entire existing base.
Why is the figure limited to systems up to 30 kWp?
That band keeps the measurement anchored to residential rooftop work. Beyond it, systems start to look like small commercial installations with different duty cycles and different economics, which would compare unlike things on the same curve.
Is a shorter market history a disadvantage for Flagstaff?
Not for a homeowner weighing the decision. A market that moves later gets to watch what happened elsewhere first, which means the design conventions, the tariff outlook and the equipment choices are better understood by the time the decision arrives.