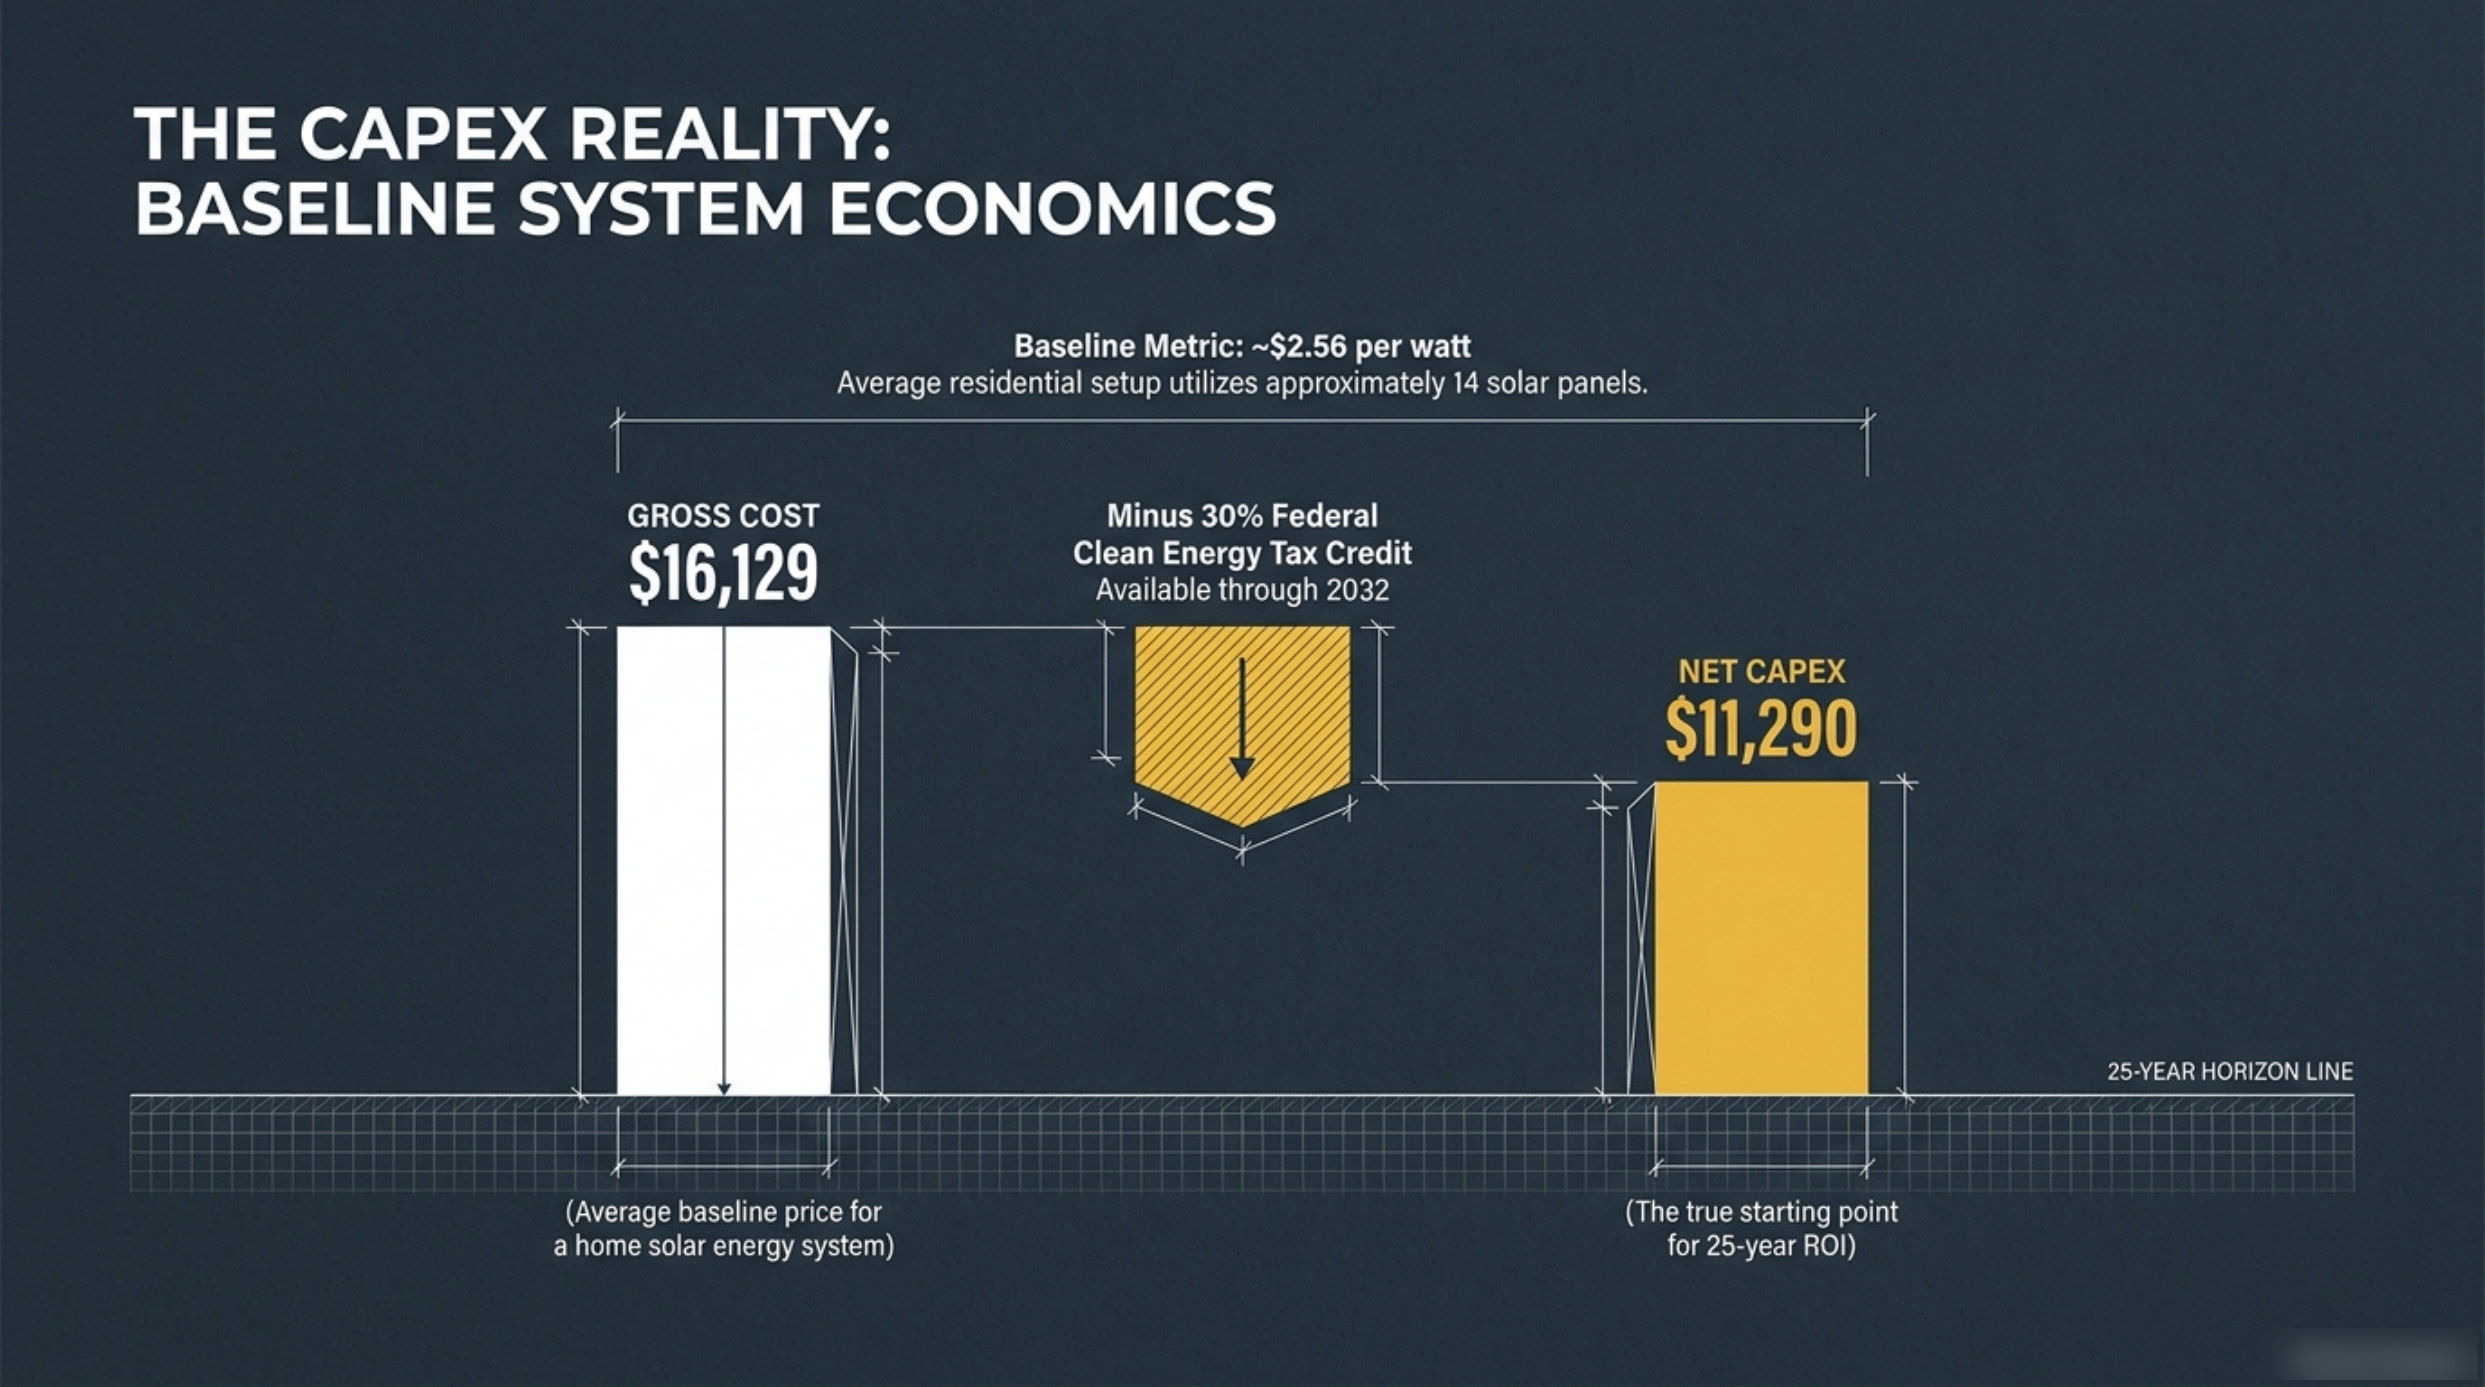
Solar quotes in Flagstaff arrive as a single headline number, usually a gross price with a tax credit subtracted underneath it. That headline is useful, but it is not a rate, and comparing two systems on it is comparing two totals. The number that travels is the price per watt — and the baseline this deck works from is roughly $2.56 per watt for a typical residential installation.
The second slide of the 25-year ownership model turns that rate into a pair of figures. Gross cost lands at $16,129. Subtract the 30% federal Clean Energy Tax Credit, available through 2032, and net capital cost settles at $11,290. Everything the model projects for the next quarter-century compounds against that second number, not the first.
A per-watt figure is a rate, not a price
The reason the deck leads with $2.56 per watt rather than with $16,129 is that a rate survives changes in system size. If your roof takes twelve panels instead of fourteen, the gross price moves but the rate should not, which means the rate is the number you can hold a contractor to while your own scope is still moving. It is also the number that makes two differently sized quotes comparable at all.
| Metric | Value | What it represents |
|---|---|---|
| Baseline rate | ~$2.56/W | Installed cost per watt of capacity before incentives |
| Typical array | ~14 panels | Average residential setup the baseline is modelled on |
| Implied capacity | ~6,300 W | $16,129 ÷ $2.56 per watt |
| Gross cost | $16,129 | Average baseline price for a home solar energy system |
| Federal credit at 30% | −$4,839 | Clean Energy Tax Credit, available through 2032 |
| Net CapEx | $11,290 | The true starting point for the 25-year return calculation |
What fourteen panels actually describes
Fourteen panels is a useful size to picture because it is small enough to fit most Flagstaff roofs and large enough to matter. Dividing the gross cost by the baseline rate gives roughly 6,300 watts of capacity, and spreading that across fourteen modules implies panels in the 450 watt class — the mainstream rating for the current generation of commercial modules.
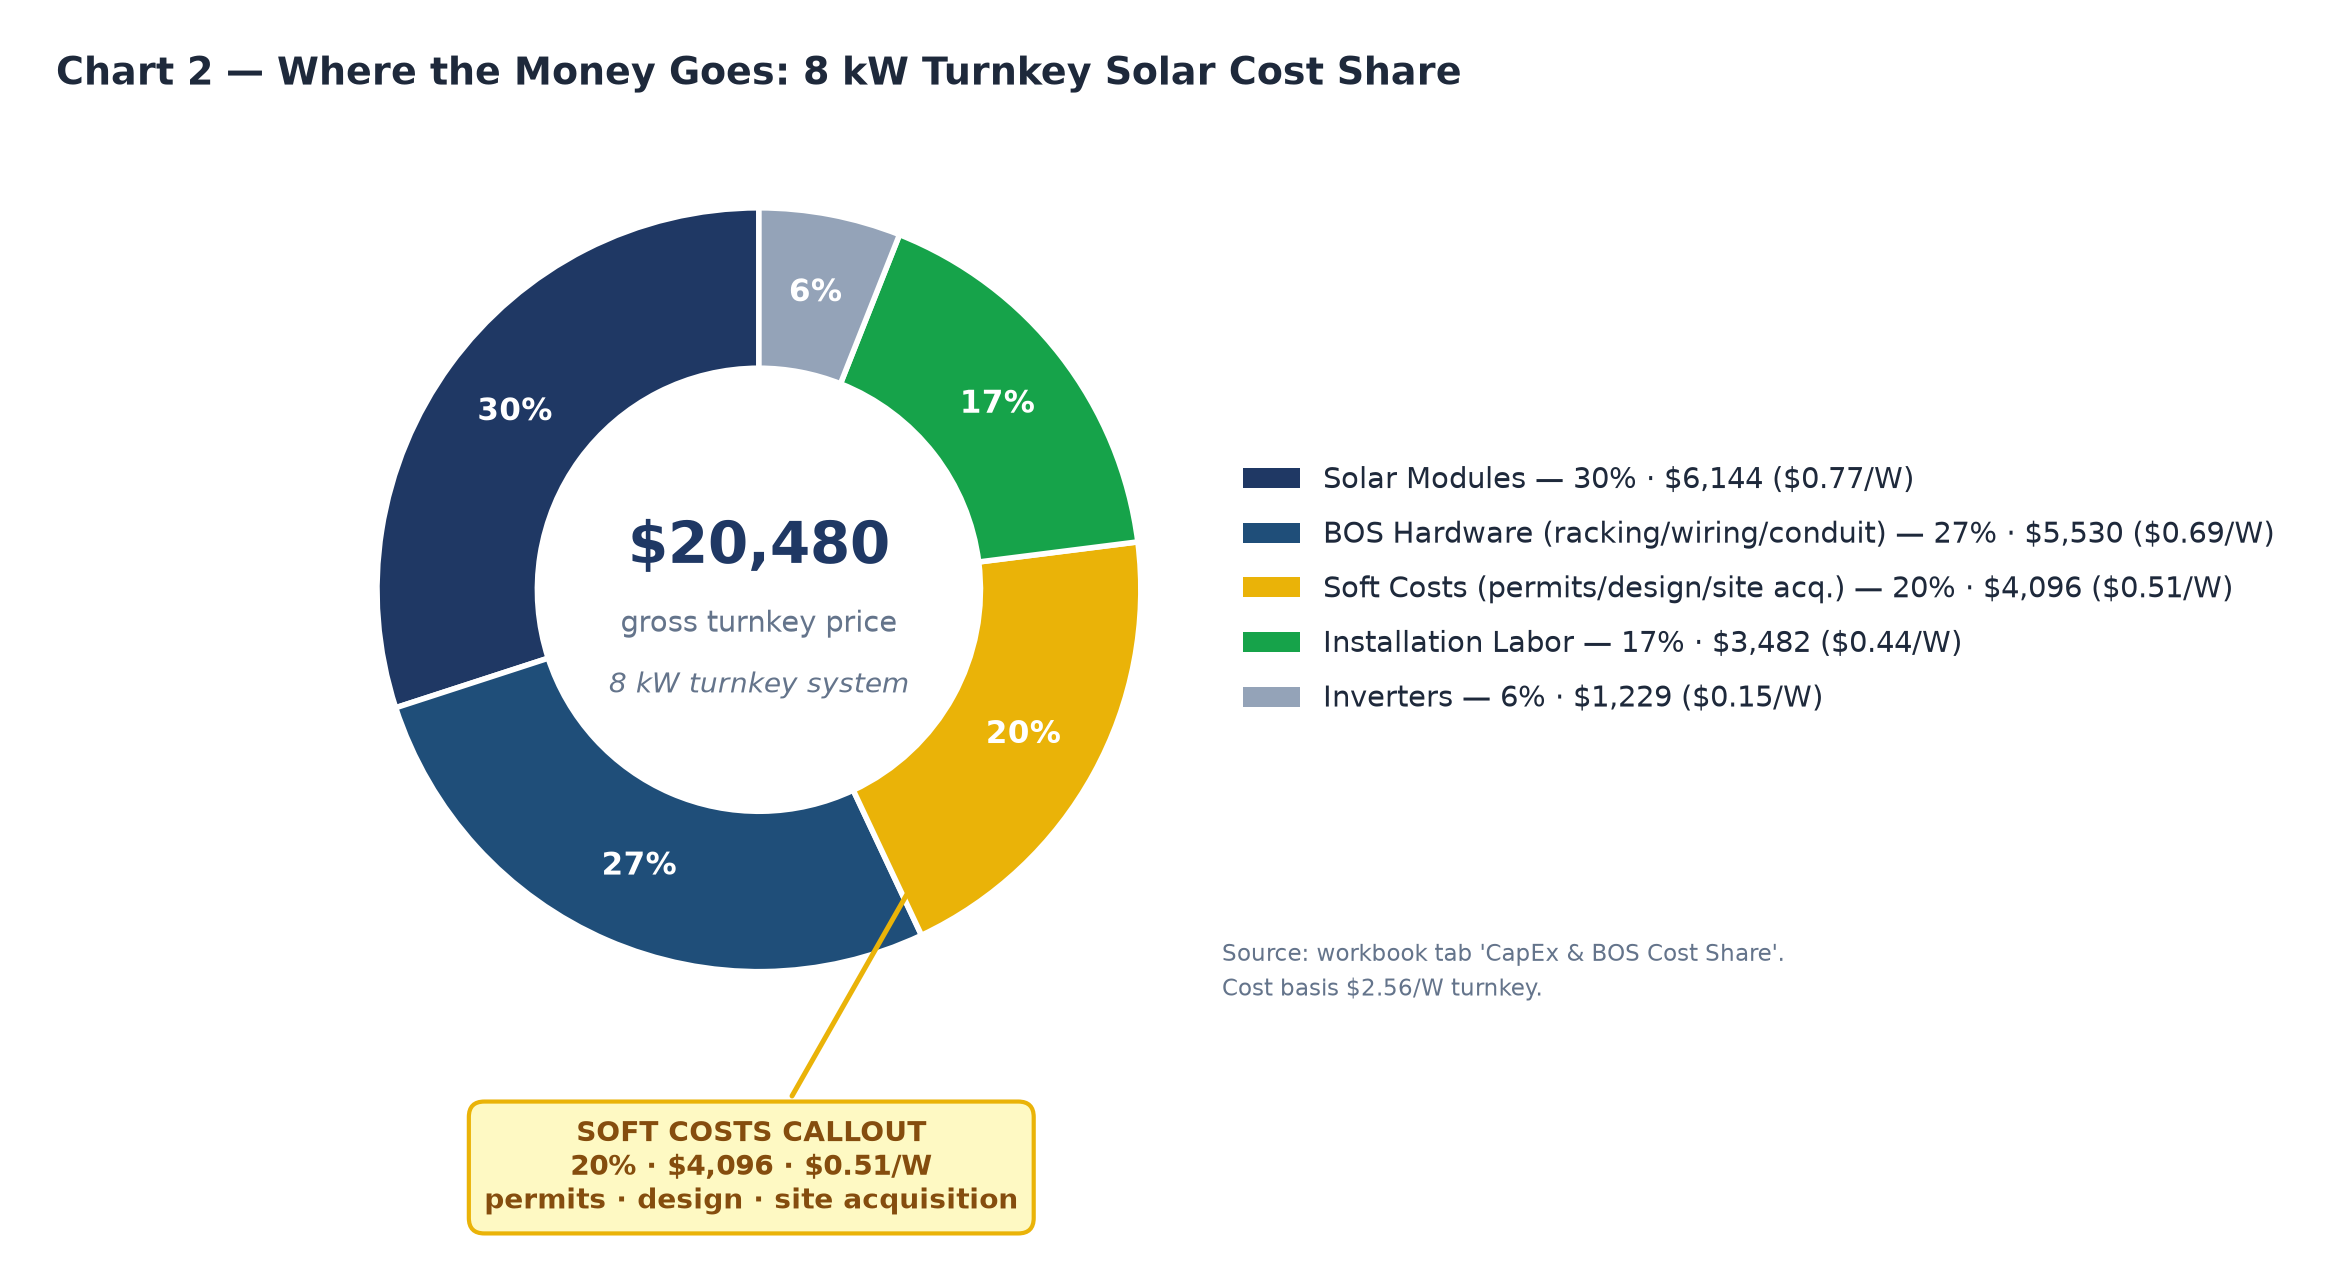
That arithmetic matters when a quote arrives with a different panel count. Twenty 315 watt panels and fourteen 450 watt panels produce comparable capacity, but they do not produce comparable labour, comparable racking or comparable wire runs. More panels means more roof penetrations, more rail, more time on the roof and more of the balance-of-system line. The rate on the quote may look identical while the underlying build is not, which is why the itemised view in our guide to turnkey solar installation costs breaks the gross price into five separate buckets rather than one total.
The credit: what 30% actually removes
The federal Clean Energy Tax Credit is the single largest line in the model, and it is worth being precise about its mechanics. Thirty percent of a $16,129 gross cost is $4,839. Subtract that and the homeowner's net capital commitment is $11,290 — a reduction of just under a third of the purchase price, applied against federal tax liability rather than handed over as a rebate cheque.
Two practical notes follow. The first is timing: the deck records the credit as available through 2032, so the year a system is placed in service matters to the arithmetic. The second is that the credit scales with the gross price, which means a higher quote does not automatically cost more out of pocket in net terms, but it does mean the taxpayer is effectively funding 30% of whatever is on the invoice. That is one more reason a per-watt rate is worth holding to.
How this baseline compares with a larger build
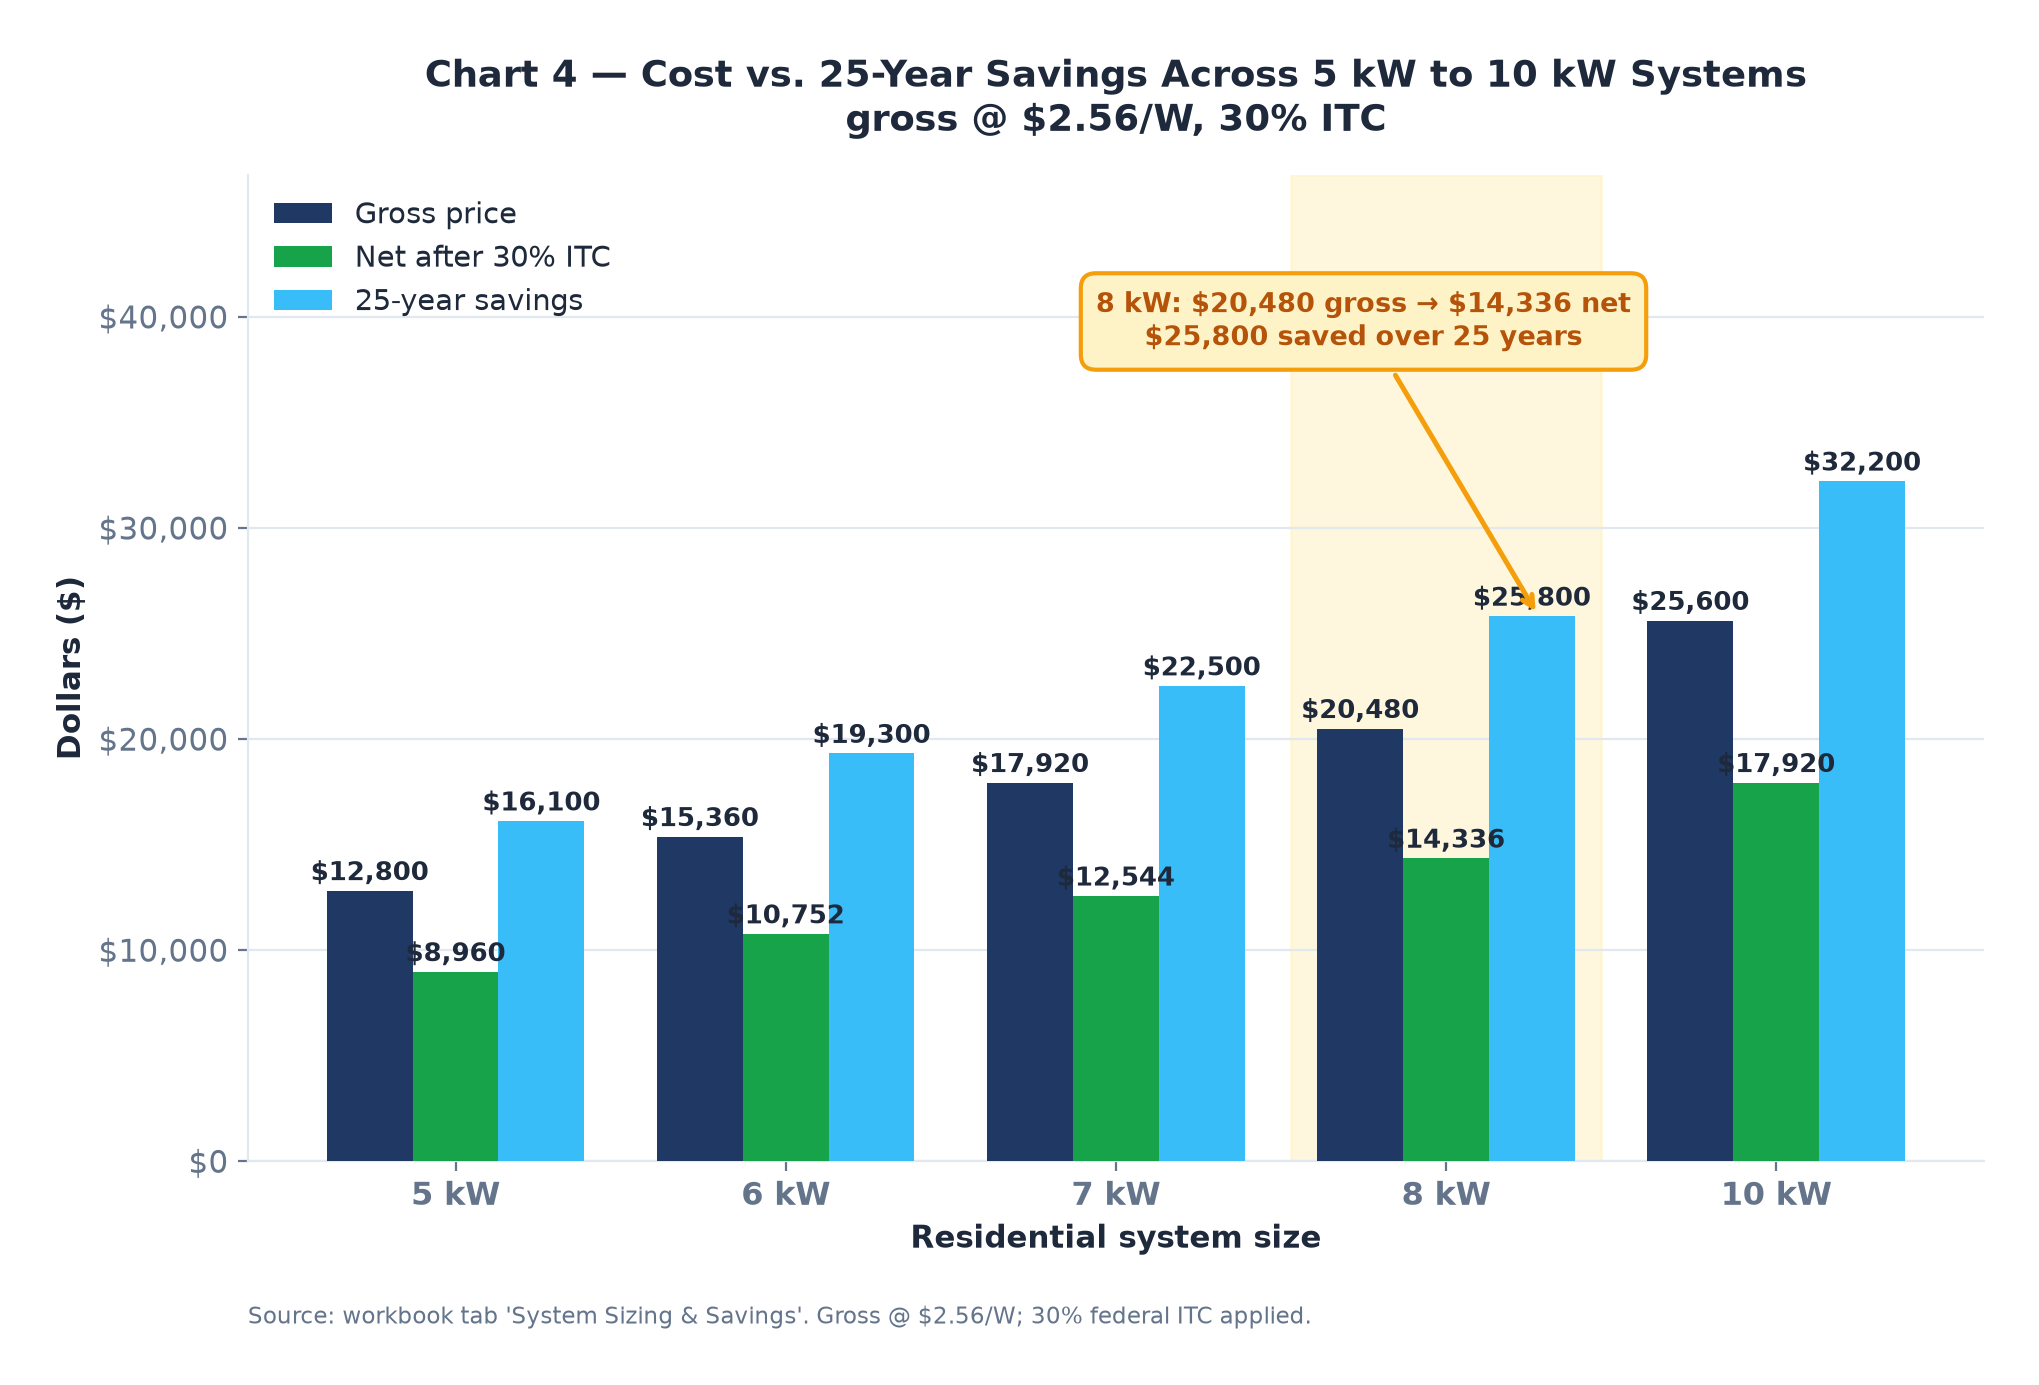
The $16,129 / $11,290 pair is a baseline, not a ceiling. A larger 8 kW system priced turnkey at $20,480 produces a net figure of $14,336 after the same 30% credit, and the same structural logic applies: gross cost, credit, net capital. What changes with size is the split between hardware and the labour that installs it, and that is where the baseline model is most useful as a comparison tool rather than a target.
For the market-wide context — how equipment tiers, system size and incentives interact in this specific territory — How Much Does Solar Cost in Flagstaff? remains the reference. The contribution this slide makes is narrower and more useful: it fixes the rate, fixes the panel count, and separates the price from the cost.
Call (928) 698-6192 for free, no-obligation quotes from pre-vetted Flagstaff solar professionals.
Frequently asked questions
Is $2.56 per watt a good price for solar in Flagstaff?
Treat it as the baseline rather than a target. The deck uses it as the average residential rate before incentives, which makes it the reference point a quote is measured against. A quote at or below the baseline needs no special explanation. A quote materially above it deserves a line-by-line justification, and the soft-cost bucket is usually where that justification is made.
How does the 30% credit turn $16,129 into $11,290?
Thirty percent of $16,129 is $4,839. Subtracting that from the gross cost leaves $11,290. The deck notes the credit is available through 2032, and because it is applied against federal tax liability rather than paid out as cash, it is worth confirming with a tax professional how it lands in your own return.
Why does the model use fourteen panels as the baseline?
Because it represents an average residential setup at the baseline rate. Fourteen panels at roughly 450 watts each is about 6,300 watts of capacity, which is the implied system size behind the $16,129 gross figure. If your own roof fits a different panel count, the rate stays the comparison point and the total moves.