Four financing routes exist for the same rooftop array in Flagstaff: you can buy it with cash, buy it with a loan, rent it through a lease, or buy only the electricity through a power purchase agreement. The panels, the roof penetration and the production are identical in every case. What changes is who owns the electrons, who claims the tax credit, and how much of the 25-year value stays with you.
This guide uses one fixed system for every comparison: an 8 kW turnkey array priced at $20,480 gross, or $2.56 per watt. After the 30% federal Investment Tax Credit of $6,144, the net upfront cost lands at $14,336. That array produces a projected $25,800 in cumulative savings over 25 years and reaches break-even in year 7. Every table below is built from those figures, so you can compare the four structures against a single, consistent baseline instead of against four sales pitches.
The four structures, on one baseline
The cleanest way to separate the four options is to compare four numbers: what you pay at signing, who keeps the tax credit, what the monthly obligation looks like, and what you hold at the end. Cash is the only structure where all four answers favour the homeowner, and it is also the only one where the $14,336 net cost is paid before a single kilowatt-hour is generated.
| Structure | Cash at signing | Owns the 30% ITC | Monthly obligation | 25-year net return |
|---|---|---|---|---|
| Cash purchase | $14,336 net | Yes — $6,144 credit | None | +$25,800 |
| Solar loan | $0 down | Yes — $6,144 credit | Loan payment to year 12 | +$19,050 (modelled) |
| Solar lease | $0 down | No — third party claims it | Lease payment, escalating | Stays near break-even |
| PPA | $0 down | No — third party claims it | Per-kWh rate at 2.5% escalator | Stays near break-even |
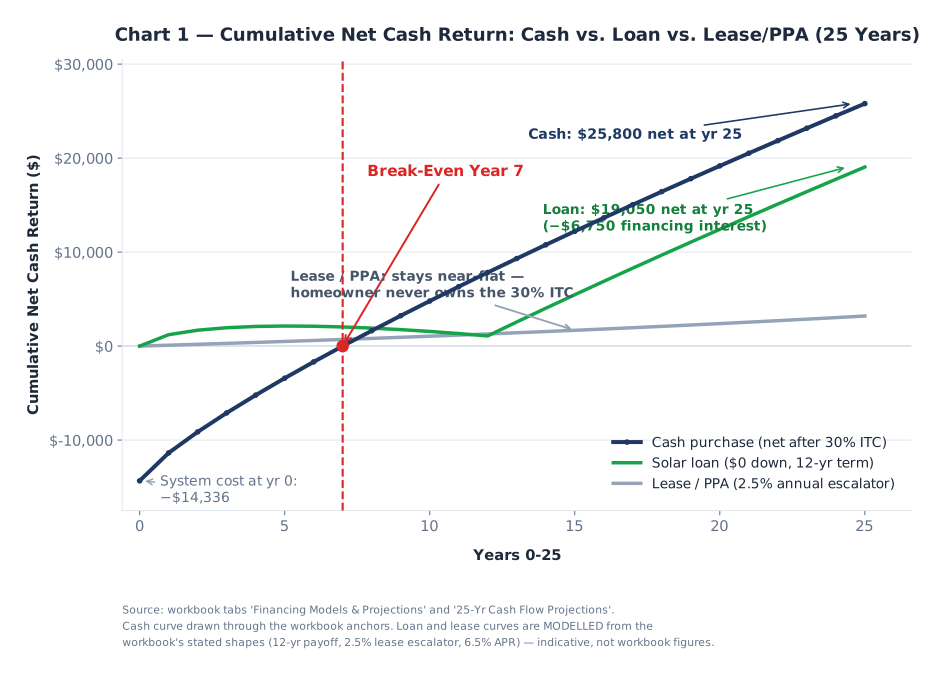
The table exposes the structural trade. Cash and loan both let you claim the $6,144 credit, which is 30% of the $20,480 gross price and — not coincidentally — exactly the $6,144 that the modules themselves cost. In other words, the federal credit pays for the panels, and everything else you spend buys the racking, the wiring, the permits, the labour and the inverter. A lease or a PPA forfeits that credit to the third party that owns the array, which is the single largest reason the lease line in Chart 1 never climbs.
Cash: the year 7 break-even
Cash is the fastest route to positive return and the only one where the arithmetic is fully transparent. You write $14,336 once, and from that point the utility bill you no longer pay is pure recovery. The modelled curve crosses zero in year 7, which means seven Flagstaff summers and winters of avoided bills repay the entire net cost of the system. From year 7 to year 25, every dollar of avoided generation is profit — $25,800 of it cumulatively by year 25.
Two workbook assumptions drive that schedule. The first is an annual utility rate escalation of 3.5%, which is why the later years of the curve are steeper than the early ones: the same kilowatt-hour you displace in year 20 is worth more than the one you displaced in year 2. The second is a panel degradation rate of 0.4% per year, applied on top of the 82% de-rate factor the model already uses for inverter losses, wiring, climate and tilt. Escalation outruns degradation, so the curve bends upward rather than flattening.
Loan: no money down, then acceleration after the payoff
A solar loan removes the upfront barrier without giving up ownership. You still claim the full $6,144 ITC, which typically covers the down payment on the loan, and you still own the asset. The cost of that convenience is interest. Modelled on the post-credit balance of $14,336 at 6.5% APR over 12 years, the payment runs about $1,757 per year and total interest reaches roughly $6,749 across the term.
That is what produces the distinctive shape of the middle curve in Chart 1. Through the payment years the loan sits only slightly positive: savings and payments roughly cancel, so the cumulative line hovers a few hundred to a couple of thousand dollars above zero. Once the loan pays off at year 12, the full value of avoided generation drops straight to the homeowner and the curve accelerates hard, finishing the 25-year window at about $19,050 — the cash result of $25,800 minus the interest paid. Financing is not free, but it costs about $6,749 rather than the entire ITC.
| Option | Year 0 | Year 1 | Year 7 | Year 10 | Year 12 | Year 25 |
|---|---|---|---|---|---|---|
| Cash purchase | −$14,336 | −$11,365 | $0 | +$4,794 | +$7,833 | +$25,800 |
| Solar loan (12-yr payoff) | $0 | +$1,214 | +$2,036 | +$1,558 | +$1,083 | +$19,050 |
| Lease / PPA (2.5% escalator) | $0 | +$94 | +$707 | +$1,050 | +$1,292 | near break-even |
Note the dip in the loan row between year 7 and year 12. It is not a modelling error: it is the visible point where the escalating value of avoided electricity stops outrunning a fixed loan payment. The line recovers the moment the payment ends, which is why the loan curve's steepest section is years 13 through 25 rather than years 1 through 12.
Lease and PPA: low friction, low ceiling
Leases and PPAs are sold on the same promise — no money down, someone else handles maintenance, and your bill drops from day one. That promise is real, and for a household that cannot use a tax credit at all it can be the only practical route to solar. The catch is structural rather than cosmetic.
Both products carry a 2.5% annual escalator, which means the payment rises every year whether or not the utility rate does. Meanwhile the homeowner builds no equity, claims no credit and cannot monetise the asset at resale. The workbook models this as a near-flat line: cumulative return drifts slowly upward and stays in the low thousands by year 25, against $25,800 for cash and $19,050 for the loan. A lease is a service, not an investment, and the spreadsheet treats it that way.
| If your situation is… | Best structure | Why |
|---|---|---|
| You have the $14,336 and will stay 7+ years | Cash | Year-7 break-even, highest 25-year return at $25,800 |
| You have limited cash but pay federal tax | Solar loan | Keep the $6,144 ITC, no down payment, $19,050 by year 25 |
| You cannot use the tax credit at all | Lease or PPA | Captures bill savings without needing tax appetite |
| You may sell the home within 5 years | Cash or loan | Ownership travels with the property; leases transfer only with buyer consent |
What this means for a Flagstaff household
Run the same 8 kW array against a $180 monthly electric bill and $0.16 per kilowatt-hour, and the financing choice is worth more than $6,700 in interest-avoided spread alone. The cash buyer puts $14,336 in and takes $25,800 out. The loan buyer puts $0 in, pays roughly $1,757 a year for 12 years, and takes $19,050 out — a return on zero invested capital, which is a genuinely good outcome, just a smaller one. The lease buyer takes out the few thousand dollars of bill relief and never touches the ITC.
Escalation cuts the other way too. With utility rates rising 3.5% a year and lease payments rising 2.5%, the gap between them narrows slowly, which is why the lease line creeps upward instead of falling. But 3.5% minus 2.5% is a single percentage point of drift against a $25,800 ceiling that belongs to someone else. Over a 25-year window that difference is the whole story.
Call (928) 698-6192 for free, no-obligation quotes from pre-vetted Flagstaff solar professionals.
Frequently asked questions
- How much does financing actually cost on an 8 kW system?
- Modelled at 6.5% APR over 12 years on the $14,336 post-credit balance, total interest is about $6,749. That reduces the 25-year net return from $25,800 (cash) to about $19,050 (loan) — you keep roughly three-quarters of the cash outcome while investing nothing up front.
- Why is break-even at year 7 rather than year 4 or year 10?
- Break-even is the point where accumulated avoided bills equal the $14,336 net cost. On the workbook's curve that crossing lands at year 7, driven by the 5.2 peak sun hours per day Flagstaff receives and the 3.5% annual utility escalation.
- Does a lease still make sense if I cannot use the 30% credit?
- Yes. A lease or PPA is the only structure that does not require federal tax appetite, and it still cuts the monthly bill. Just be clear that the $6,144 credit goes to the system owner, and your cumulative 25-year return stays near break-even instead of reaching $25,800.
- What happens to the loan curve after year 12?
- Payments stop and the entire value of avoided generation flows through. That is why the loan curve is almost flat through year 12 and then rips upward — the difference between the two regimes is a bit over $18,000 of cumulative return.