Most Flagstaff homeowners shop for solar the way they shop for an appliance: one number, one comparison, one decision. That frame breaks almost immediately. A rooftop array is not a purchase that finishes on installation day — it is an asset that produces electricity for a quarter of a century, and it deserves the treatment an investor gives any long-lived asset. Capital goes in, operating costs accrue along the way, and yield comes out at the end.
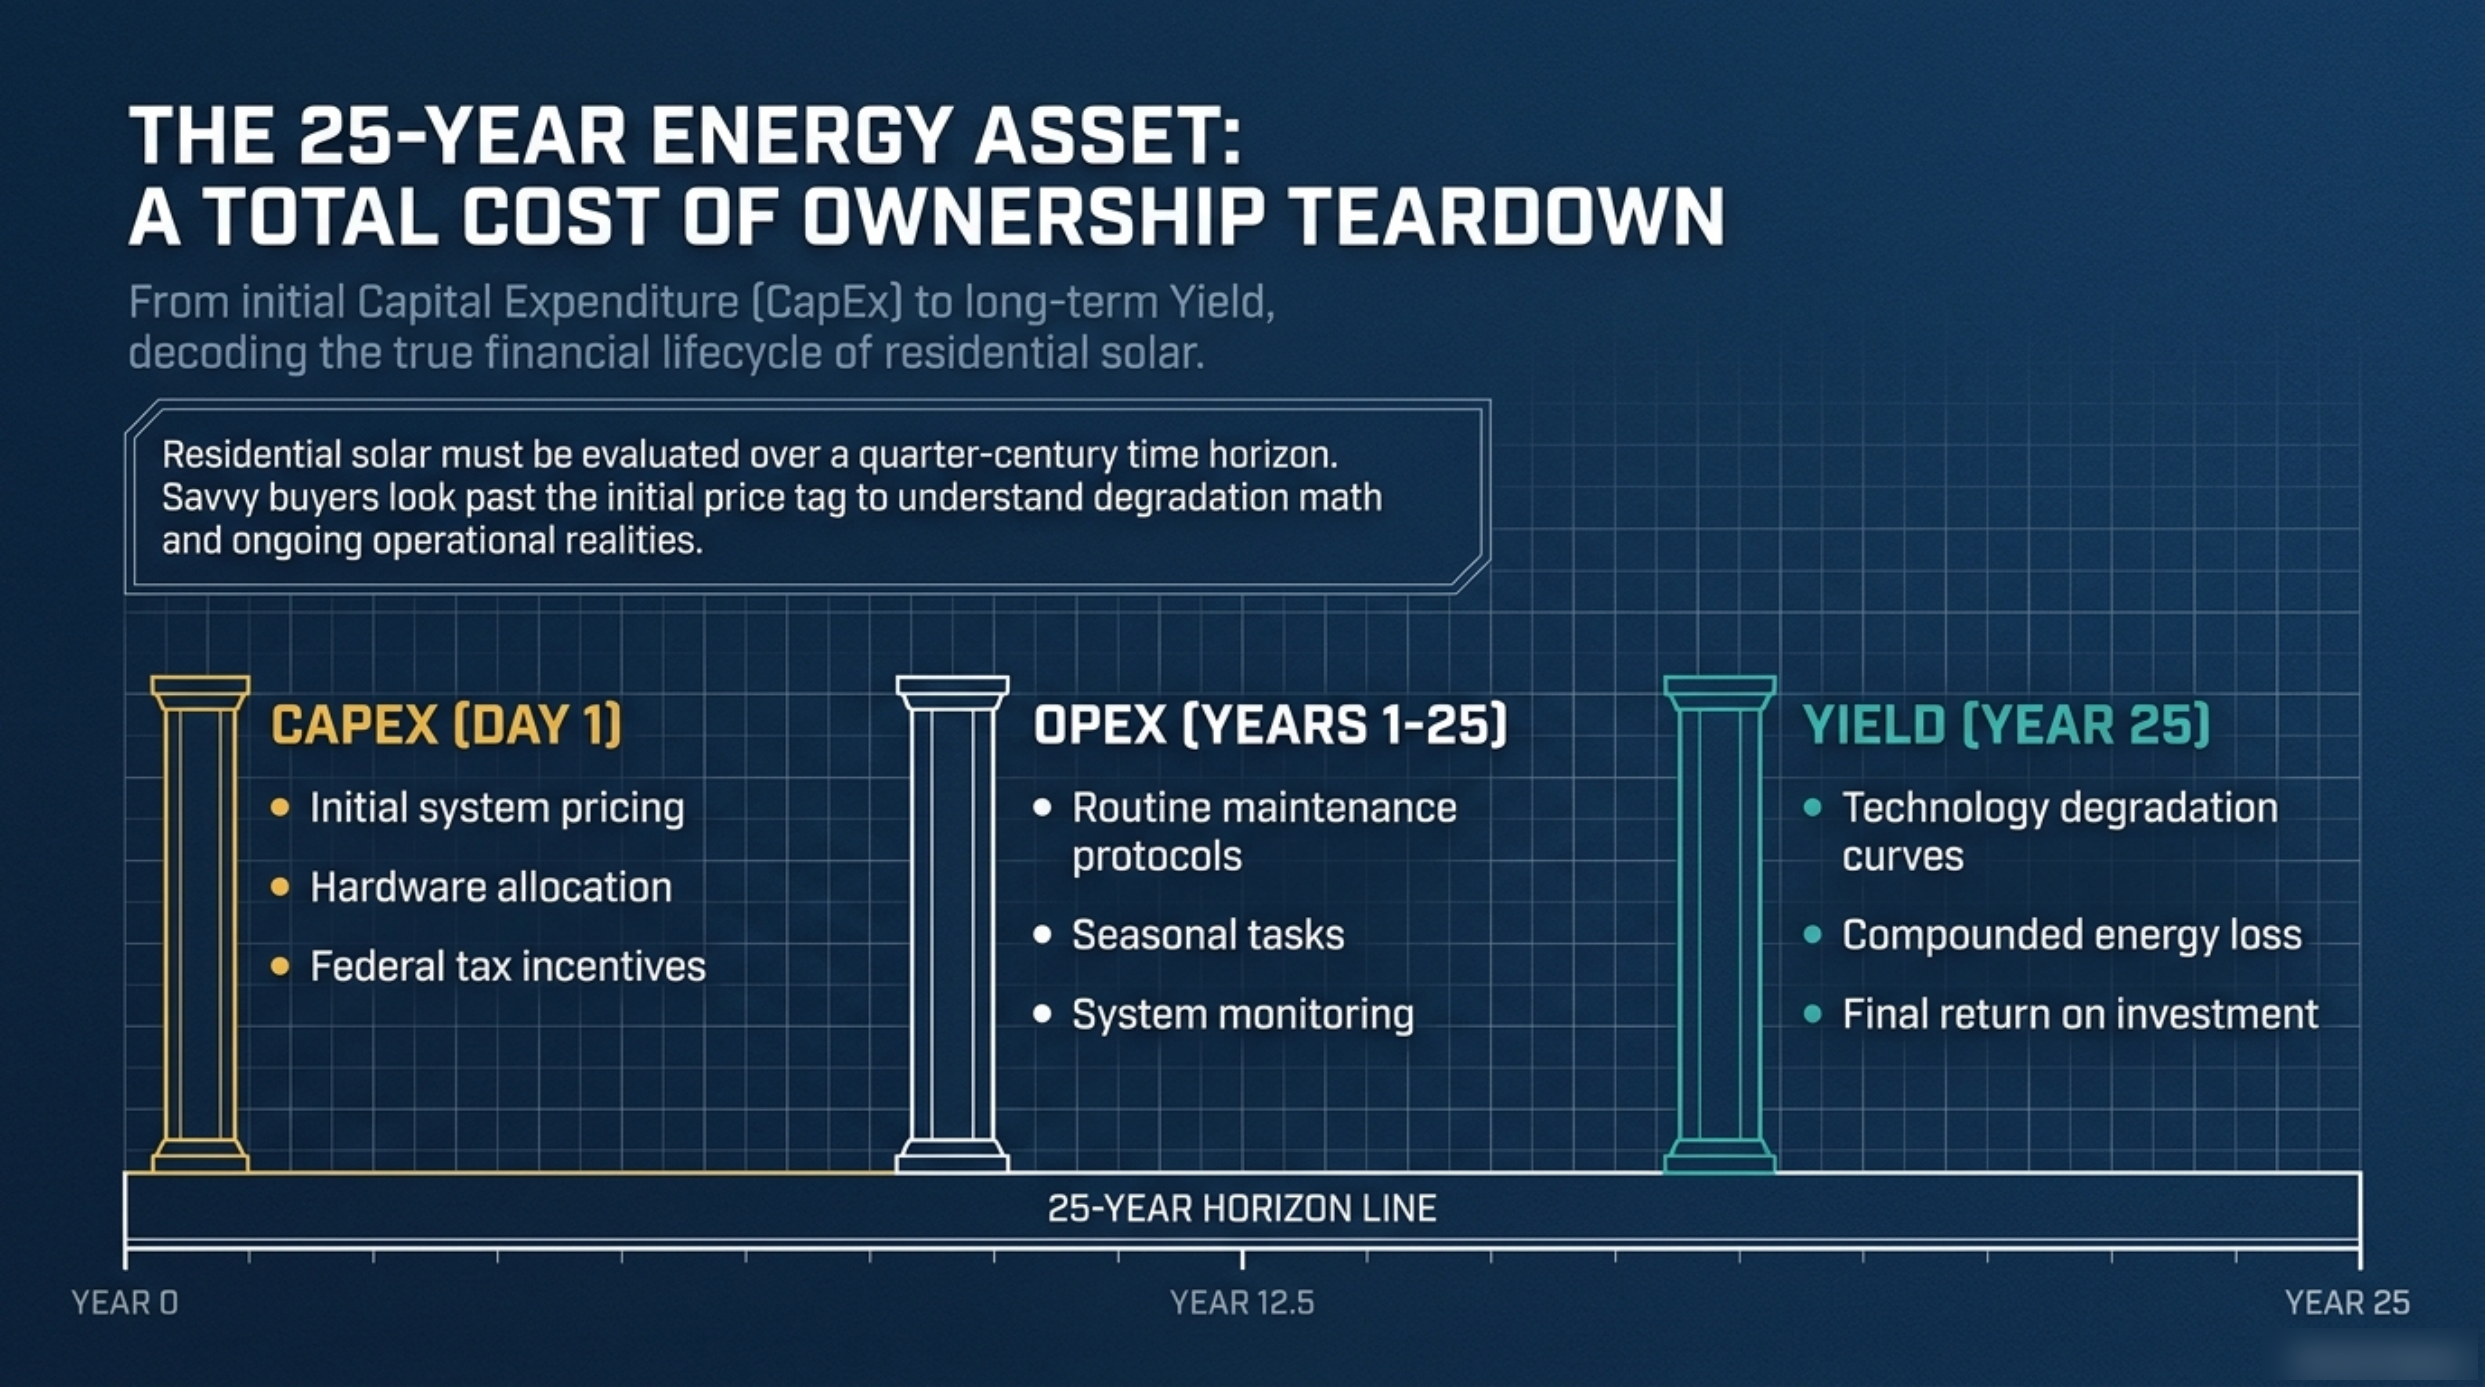
Residential solar has to be evaluated over a quarter-century time horizon. Savvy buyers look past the initial price tag to understand the degradation maths and the ongoing operational realities sitting behind it. This article works through that teardown in the order a financial model would: CapEx on day one, OpEx across years one through twenty-five, and the yield the system is still delivering in year twenty-five.
Three columns, one decision
The deck's organising idea is that a solar array has three separate financial lives, and each one is measured with different instruments. CapEx is a single day's arithmetic: system pricing, hardware allocation and whatever federal tax incentives apply. OpEx is a schedule rather than a number, because it repeats. Yield is a projection, because it depends on how a specific technology behaves across decades of heat, cold and ultraviolet exposure.
Owners who only ever look at column one are not wrong so much as incomplete. They are pricing the purchase and ignoring the asset. The table below sets out what each column contains and which figure anchors it in the rest of this series.
| Column | What it contains | Anchor figure |
|---|---|---|
| CapEx [Day 1] | Initial system pricing, hardware allocation, federal tax incentives | ~$2.56 per watt; $16,129 gross, $11,290 net |
| OpEx [Years 1–25] | Routine maintenance protocols, seasonal tasks, system monitoring | 1–2 cleanings a year; a 3–5 inch row gap and 42.5 inch ground clearance for snow |
| Yield [Year 25] | Technology degradation curves, compounded energy loss, final return on investment | 84.8% / 88.9% / 93.0% output retention depending on cell type |
Why the horizon line runs the full width
Underneath all three columns the deck draws one continuous 25-year horizon line, and it is not decoration. Almost every meaningful term in a solar contract is calibrated to a point on that line. A performance warranty is written to run the whole of it. A workmanship warranty typically covers the first half. A product warranty may outlast the array's design life. The midpoint at year 12.5 is where an owner finds out whether the installation work was done properly, long after the crew has driven away.
The line also explains why degradation deserves more attention than it usually gets. Losses compound rather than accumulate. A panel that sheds half a percent of output a year is not losing half a percent of its original figure each year — it is shedding half a percent of whatever it produced the year before. Over twenty-five years that difference separates technologies that looked nearly identical on the datasheet.
Day one: the number that gets argued about
Column one is where quotes live and where homeowners spend most of their attention. The deck's baseline model puts a typical Flagstaff residential system at roughly $2.56 per watt, using about fourteen panels. That produces a gross cost of $16,129 before incentives, and a net capital cost of $11,290 once the 30% federal Clean Energy Tax Credit is subtracted. The credit is available through 2032.
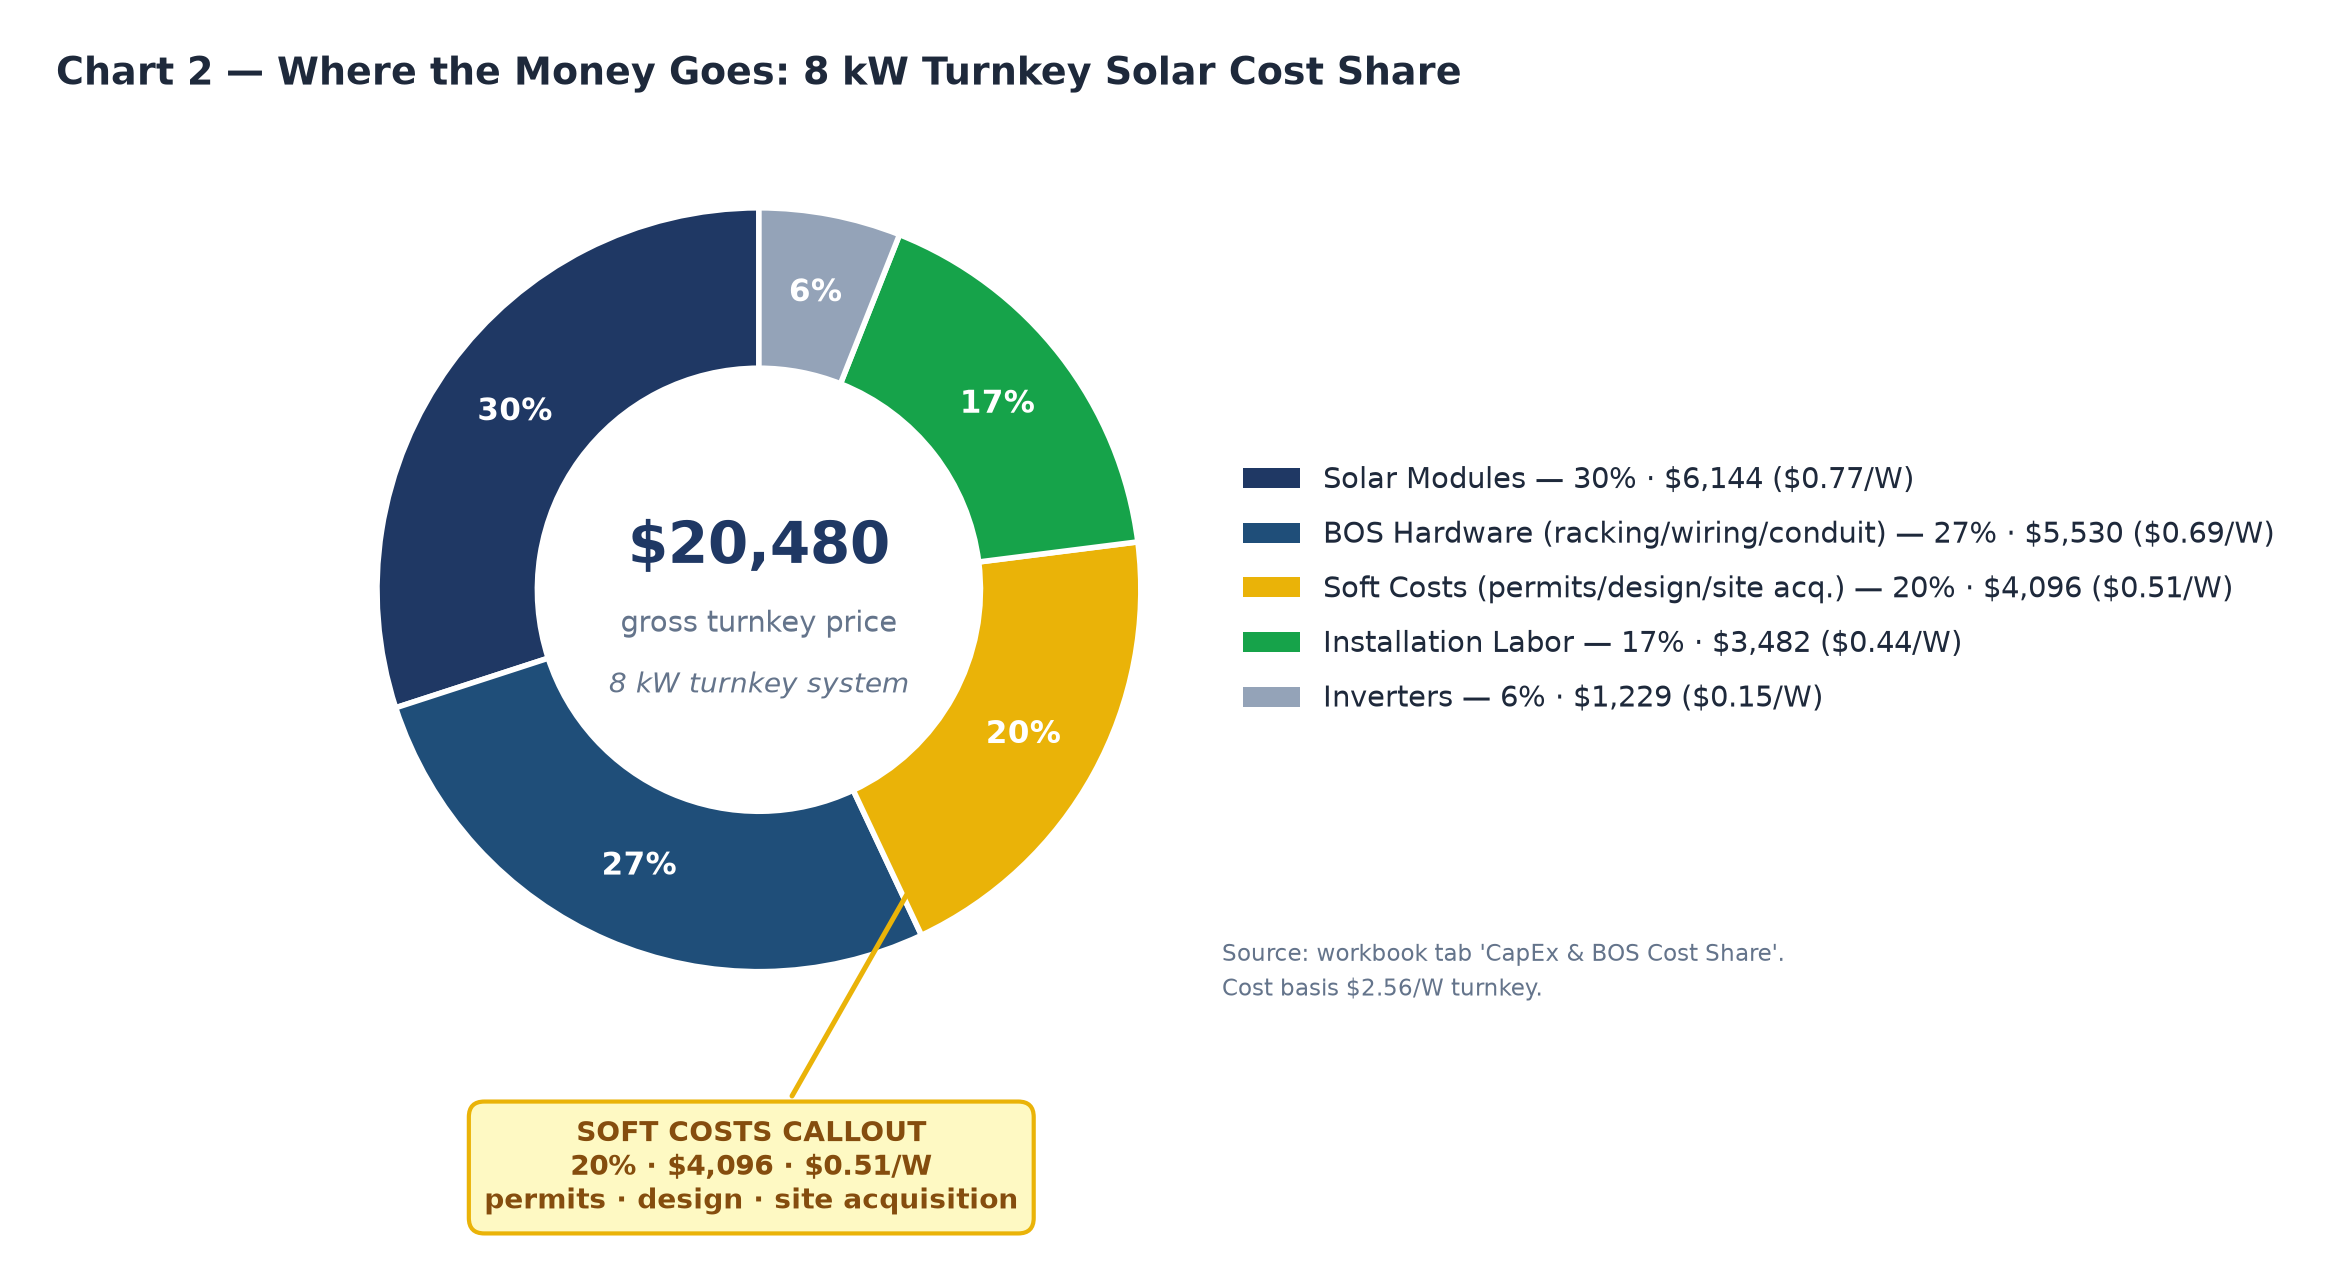
Two things are worth noticing there. The first is that the day-one figure is the only part of the three-column model that is fully negotiable, which is exactly why it consumes so much of the conversation. The second is that it is also the smallest part of the risk. If you want to see how the gross price divides across modules, inverters, balance-of-system hardware, soft costs and installation labour, that breakdown is worked through in our itemised guide to turnkey solar installation costs. For the broader cost picture in this market — incentives, size, equipment tiers — How Much Does Solar Cost in Flagstaff? remains the starting point.
Years 1 to 25: the column nobody quotes
OpEx is the part of ownership that no salesperson itemises, because it is small, slow and unglamorous. The deck schedules it as routine maintenance protocols: seasonal cleaning once or twice a year to clear pine needles, dust and pollen; periodic visual inspections for the localised damage, debris build-up and loose wiring that monitoring software cannot see; a winter routine that keeps snow moving instead of piling up; and continuous inverter diagnostics through a monitoring app to catch clipping events and mismatched string sizing.
None of it is expensive, and all of it is optional in the same way that changing oil is optional. An array that never gets inspected will usually still generate, but it will quietly drift below its engineered baseline, and by the time a fault is obvious it has often been costing money for months. If you want the winter half of that routine in detail — the snow-shedding geometry and what to do about accumulation — Solar Panels and Snow: A Flagstaff Guide covers it specifically.
Year 25: the column nobody can renegotiate
Yield is where the model finally pays out. The deck's technology retention matrix puts legacy PERC cells at 84.8% of output at year twenty-five, TOPCon at 88.9% and heterojunction at 93.0%. Across a 6,300 watt baseline array that spread is worth hundreds of watts still being generated in the final year of the warranty, on a system that was paid off and amortised a decade earlier. We compare those three architectures line by line in TOPCon vs. HJT vs. PERC.
Read together, the three columns say something simple. The day-one price is a one-time argument worth having, the maintenance routine is a small annual habit, and the retention curve is the part that decides whether twenty-five years of ownership produced a good return or an average one. The first is easy to change. The second is easy to ignore. The third is decided the day the panels are specified.
Call (928) 698-6192 for free, no-obligation quotes from pre-vetted Flagstaff solar professionals.
Frequently asked questions
Should I judge a solar system on the 25-year timeframe or the payback period?
Both, in order. Payback tells you how quickly the day-one capital is recovered out of avoided utility bills. The 25-year horizon tells you what the asset is still worth after that. A system that breaks even in year five and is still holding output near its engineered baseline in year twenty-five is a different investment from one that breaks even in year five and has fallen well below it.
How much will maintenance actually cost over 25 years?
The recurring work is modest: one or two cleanings a year, an annual visual inspection, a winter snow routine and continuous inverter monitoring. The variable is faults rather than servicing. Continuous diagnostics exist so that an inverter problem or a shading issue is caught in weeks rather than discovered as a bill anomaly at the end of a season.
Does the 30% tax credit change the 25-year maths?
It changes column one only. On the deck's baseline of $16,129 gross, the credit removes roughly $4,839 and leaves a net capital cost near $11,290. That is the figure the rest of the 25-year model compounds against, because avoided utility costs and degradation curves do not care whether the capital came from a bank or a tax offset.